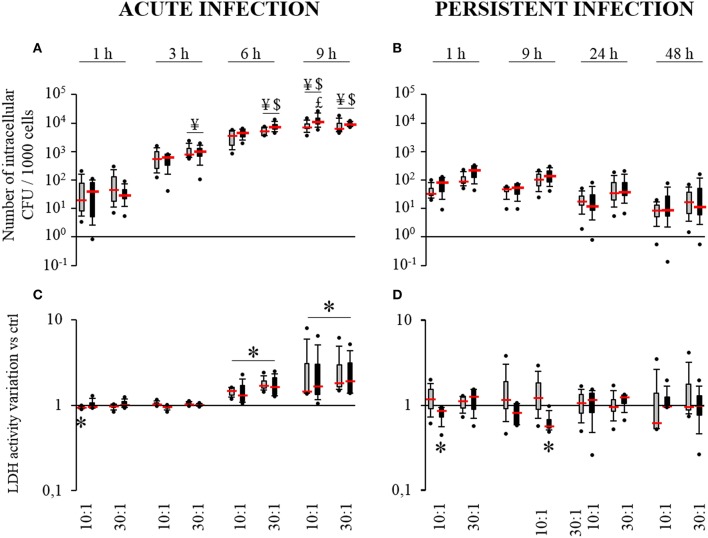
Figure 2.
Internalization (A) and survival of S. aureus (B) and effect of S. aureus on cell death (C,D). SM- (gray boxes) and OM-HPBCs (black boxes) were exposed to viable S. aureus (MOI of 10:1 and 30:1) for 1, 3, 6, and 9 h in acute infection (A,C) and for 1, 9, 24, and 48 h in persistent infection (B,D). For internalization (A) and survival of S. aureus (B), the number of intracellular bacteria was determined after serial plating. ¥ means p < 0.05 compared to value at 1 h for the same MOI, $ means p < 0.05 compared to value at 3 h for the same MOI, $ means p < 0.05 compared to value at 6 h for the same MOI. For cell viability (C,D), LDH activity was measured in cell supernatants. Data are shown as specific variation in optical density compared to optical density of relative non-infected cells. * means p < 0.05 compared to non-infected cells. Experiments were performed on four independent donors.

