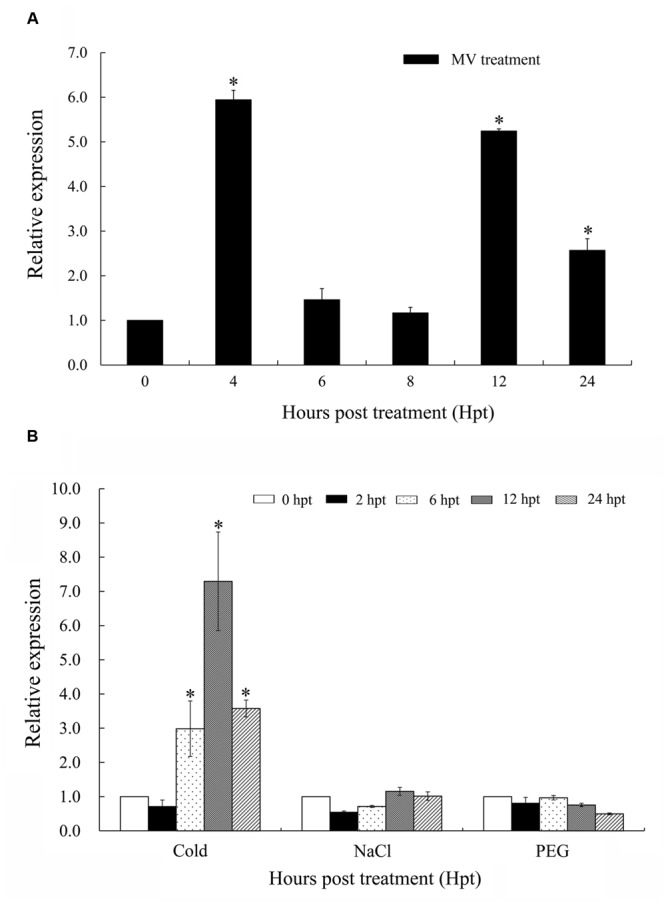
FIGURE 3.

Expression patterns of TaTypA in wheat leaves based on qRT-PCR analyses. (A) Expression levels of TaTypA in wheat leaves in response to MV treatment. (B) Expression profiles of TaTypA in wheat leaves after treatment with environmental stresses: low temperature (4°C), salt (NaCl), and drought (PEG). The expression levels were analyzed by qRT-PCR and normalized to the wheat elongation factor TaEF-1a gene. Means and standard deviations were based on three independent biological replicates. Asterisks indicate a significant difference (P < 0.05) from 0 hpt by Tukey’s HSD test.
