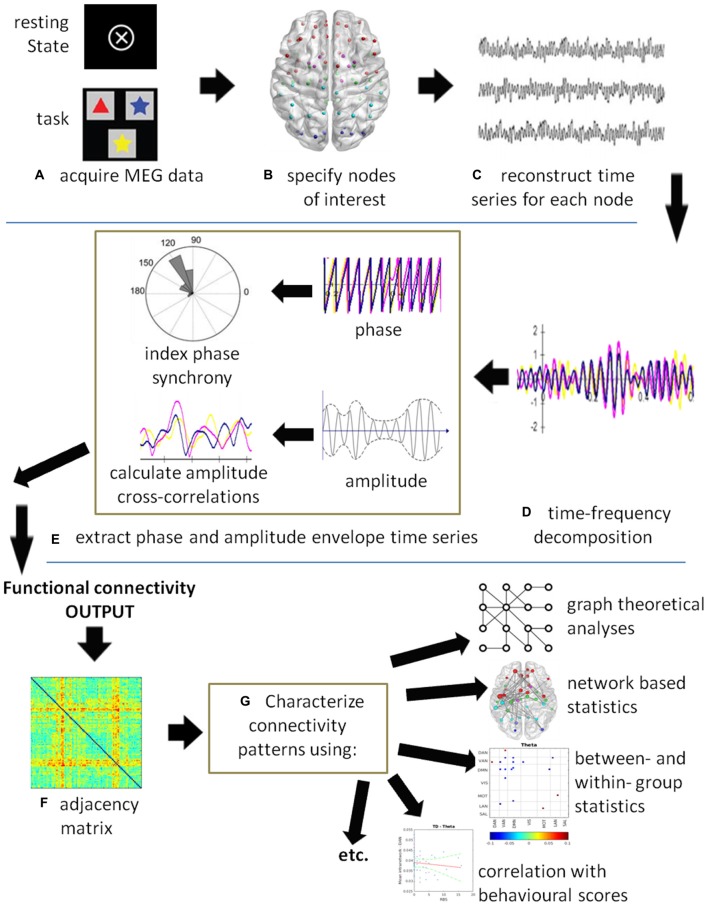
Figure 1.
A schematic of a generic magnetoencephalography (MEG) connectivity pipeline. (A) MEG data can be acquired with or without a task. (B) Nodes of interest can be derived from specific coordinates obtained by source analysis, from the literature, or using either a grid- or atlas-based approach. (C) A time series is reconstructed for each node of interest. (D) Time-series decomposition is most commonly completed using a Hilbert or wavelet transform, although other methods can be used. At this stage, the data could be submitted to causality analysis to compute effective connectivity. (E) The phase and/or amplitude envelope information is extracted and correlations computed between all node pairs at each time point. Commonly used are the phase lag index (PLI), weighted PLI (wPLI), sometimes the phase locking value (PLV), and amplitude correlations. (F) The resultant output is an adjacency matrix showing connectivity between all node pairs. In this example, a color plot is used where red indicates highly connected nodes, although other types of plots may be used. (G) The connectivity results can be submitted to statistics depending on the question of interest. For example, graph theoretical metrics and network based statistics can be used to characterize the connectivity patterns in the networks. Group level statistics can be conducted using partial-least squares (PLS) or permutation testing. Individual scores on behavioral and neuropsychological assessments can be correlated with connectivity measures and submitted to a regression analysis.

