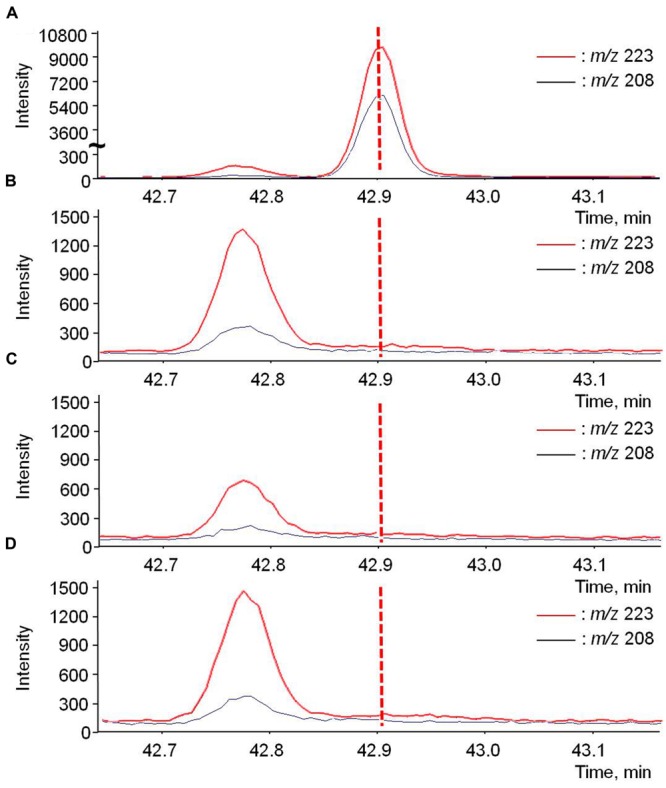
FIGURE 6.

GC-MS chromatograms of d5-rotundone (m/z 208 and 223) present in the phloem exudates of (A) positive control-phloem, (B) negative control-phloem, (C) whole leaves treatment, and (D) cut leaves treatment. The positive control-phloem graph (A) used a different scale of intensity compared to the rest graphs. The peak at 42.78 is irrelevant to this study.
