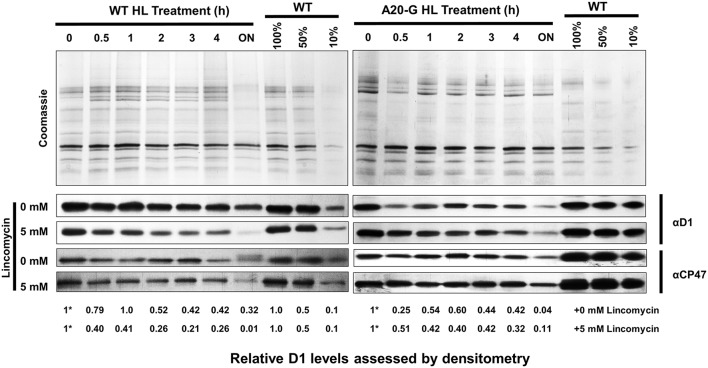
Figure 7.
Analysis of D1 degradation in mutant and WT. Leaves of WT and A20-G were exposed to high light (HL; 1000 μmol photons m−2 s−1) for a period of 4 h either in the absence or presence of 5 mM lincomycin then exposed to growth light overnight (ON; 30 μmol photons m−2 s−1). At each time point, thylakoids were harvested for immunoblotting analysis using D1 and CP47-specific antibodies. Coomassie-stained gels of untreated samples are shown to confirm loading. Relative levels of D1 were determined by densitometry with the initial amount normalized to a value of 1 indicated by asterisk. 3-month-old greenhouse-grown plants were used.

