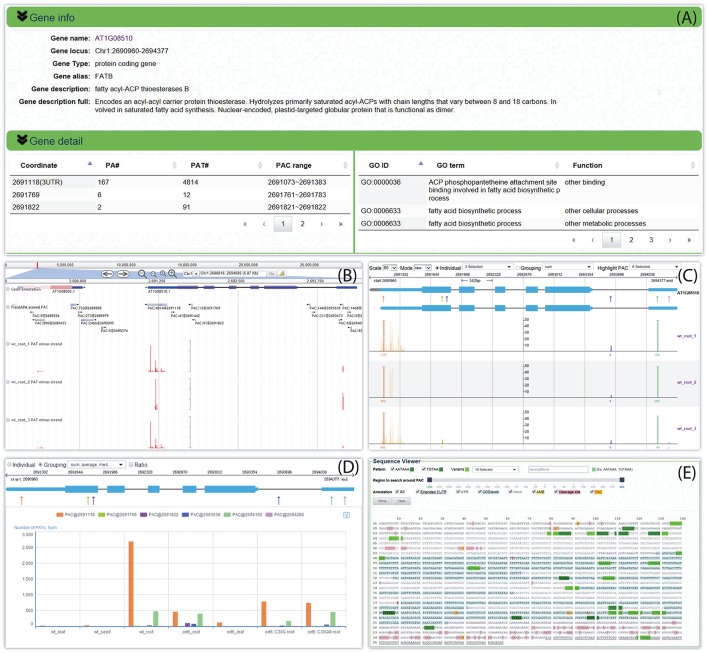
Figure 5.
Screen capture of the web page that reveals the dynamic usage of APA sites and expression pattern of FATB in Arabidopsis. (A) Summary describes basic information about this gene and tabulates all PACs and associated GO terms. (B) Screenshot of a particular section of the PAC browser to show the intron-exon structure of FATB and the PAC/PAT tracks. (C) Graph presents both the gene model and the distributions of PACs/PATs across different samples. The top gene model is the refined one with extended 3′ UTR, and the bottom one is original. Each PAC is depicted as an arrow. Cleavage sites of a PAC are depicted in vertical lines with the same color as the PAC, and the height of the line represents the number of supporting PATs. The dominant cleavage site supported by maximum number of PATs in a PAC is marked by a thick line. If the number of PATs of the dominant cleavage site exceeds the maximum scale value of the vertical axis, a small horizontal line will be shown on the top of the thick line. A text label can be found under each dominant cleavage site to clearly indicate the total number of supporting PATs of the respective PAC. (D) Bar chart profiles the usage quantification of all PACs of FATB across different groups of samples. (E) Gene sequence of FATB annotated with gene model, poly(A) signals, and cleavage sites. This example can be shown at http://bmi.xmu.edu.cn/plantapa/sequence_detail.php?species=arab&method=search&seq=AT1G08510.

