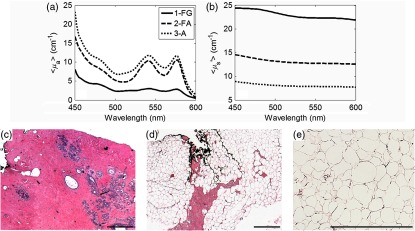
Fig. 3.
(a) The corresponding mean absorption coefficient () and (b) the mean reduced scattering coefficient () for fibroglandular (FG), fibroadipose (FA), and adipose (A). (C–E) The corresponding histology images for the fibroglandular (FG), fibroadipose (FA), and adipose (A). This figure demonstrates that adipose tissue contributes to increased absorption and fibrogalndular tissue contributes to increased scattering. The scale bars represent . The adipose H&E was imaged at while the FG and FA images were acquired at .

