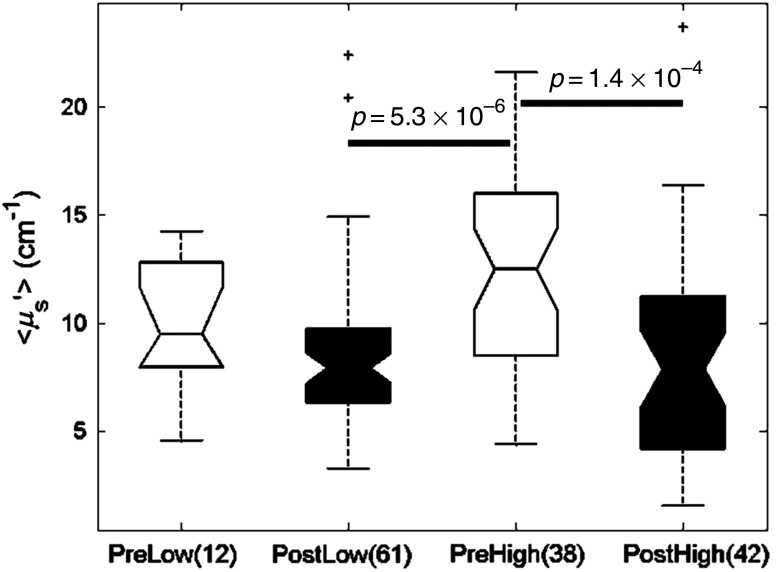
Fig. 5.
Box plots demonstrating menopausal status analysis with respect to high and low % collagen. Sites from postmenopausal patients with low and high % collagens exhibit the lowest scattering values. High % collagen sites from premenopausal patients exhibit the highest scattering values. The difference in values for malignant and benign sites is greater in postmenopausal patients.

