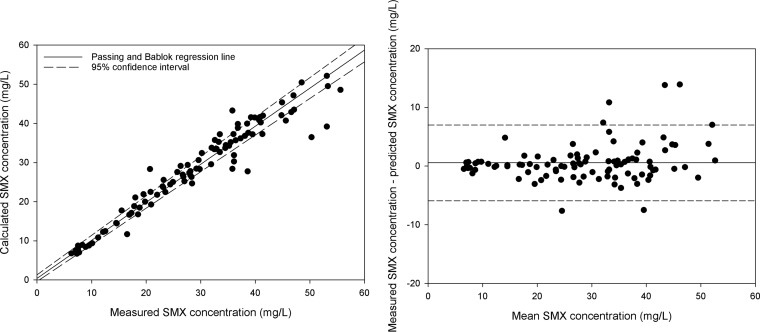
FIG 2.
(Left) Passing and Bablok regression of the observed and model calculated sulfamethoxazole concentrations (dashed lines, 95% confidence interval). (Right) Bland-Altman plot of the measured concentrations versus the predicted concentrations. The coordinates of each point (x, y) are as follows: (measured concentration + predicted concentration)/2 and measured concentration − predicted concentration.

