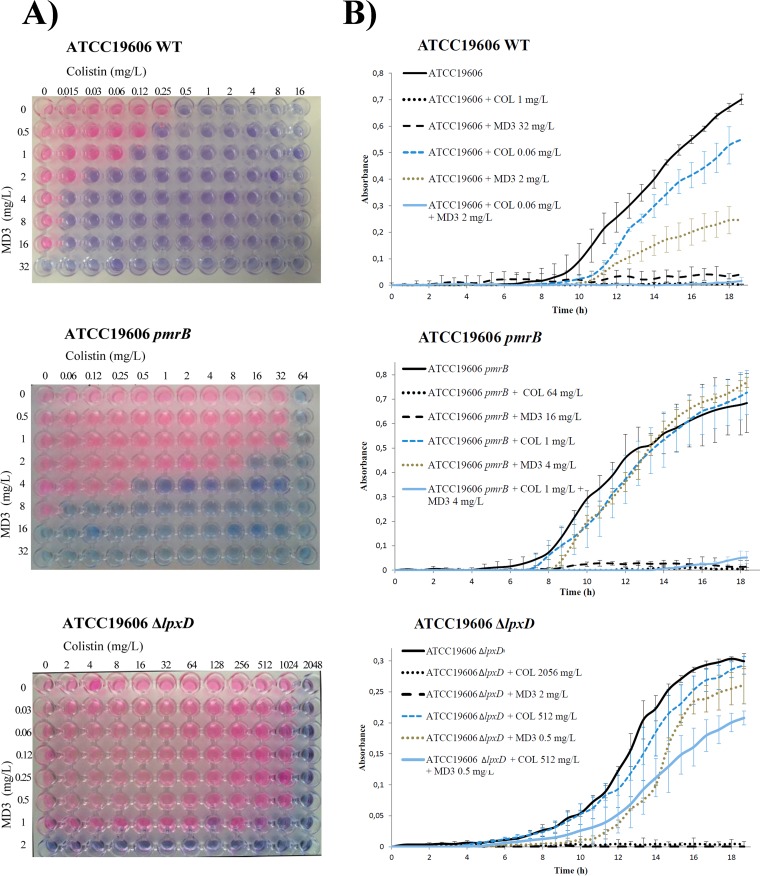
FIG 1.
Assessment of synergy. (A) Checkerboard assays using colistin and MD3 performed on cultures of ATCC 19606, ATCC 19606pmrB, and ATCC 19606ΔlpxD A. baumannii strains. Pink wells indicate growth. Blue wells indicate growth inhibition. (B) Growth curves of the same strains in the absence of antimicrobials (black line) and in the presence of colistin at their MIC (black dotted line), of MD3 at their MIC (black dashed line), of colistin at their COLMD3 MIC (blue dashed line), of MD3 at their MD3COL MIC (green dotted line), and of colistin and MD3 at the COLMD3 andMD3COL MICs (blue line). COLMD3, MICs of colistin in the presence of MD3; MD3COL, MICs of MD3 in the presence of colistin. Because of the different methodologies used in the two assays, for the growth curve assays, strains ATCC 19606 and ATCC 19606pmrB were grown in 1 mg/liter of colistin instead 0.5 mg/liter as MIC controls. Independent assays were performed at least three times.

