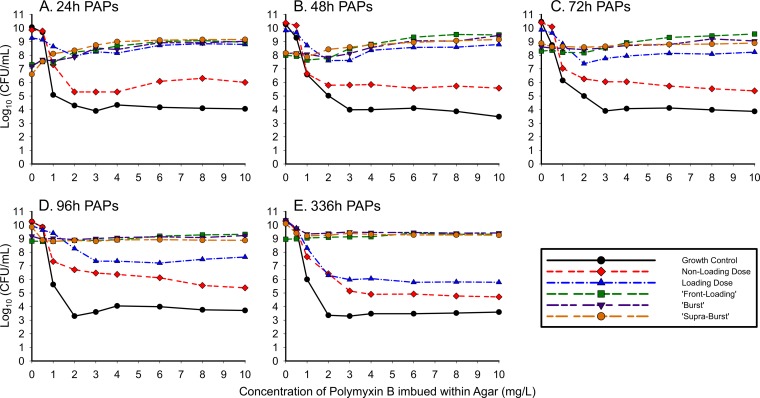
FIG 6.
Real-time population analysis profiles (PAPs) for 03-149.01 comparing different dosing regimens at 24 h (A), 48 h (B), 72 h (C), 96 h (D), and 336 h (E). Samples were quantified for total population by depositing appropriately diluted bacterial samples on MHA plates. Aliquots of the diluted sample were plated on CAMHA plates containing polymyxin B at 0.5, 1, 2, 3, 4, 6, 8, or 10 mg/liter for an in-depth analysis of the time course of resistant subpopulations at the times indicated in the panels (data for 144 h, 192 h, 240 h, and 288 h are not shown).

