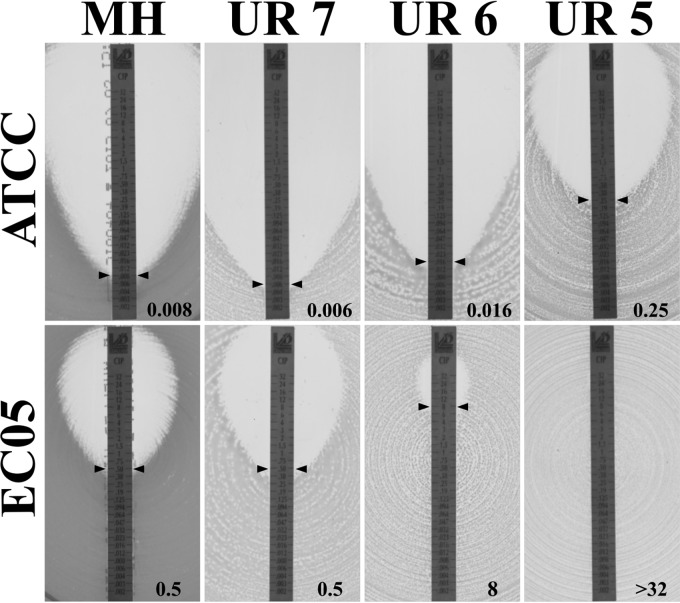
FIG 3.
CIP susceptibility testing for two representative strains (ATCC 25922 and EC05), using the gradient MIC strip methodology. It was observed that pH has a great influence on CIP activity, with a significant increase in MICs when pH decreases. MICs (shown in micrograms per milliliter) are indicated at the right bottom for each condition. UR 7, urine-agar pH 7; UR 6, urine-agar pH 6; UR 5, urine-agar pH 5.

