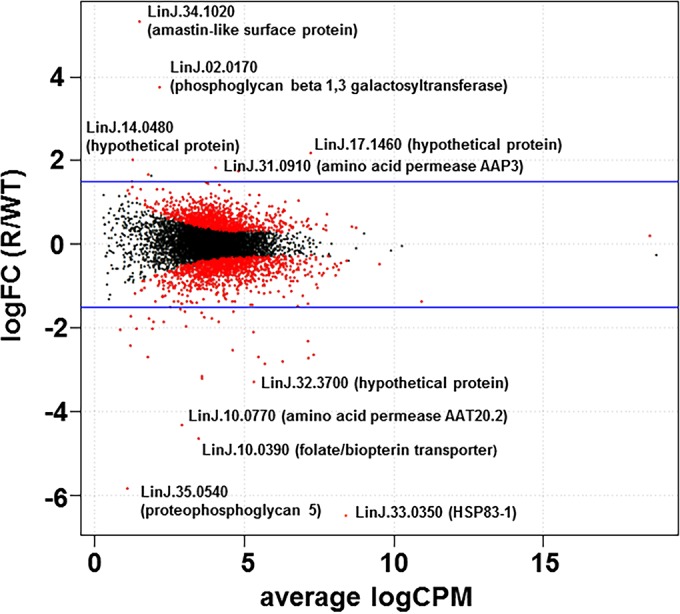
FIG 4.

RNA-seq. Shown are differentially expressed mRNAs in resistant and control L. donovani strains. The logFC of normalized expression levels between R30.1 (R) and the WT were plotted against the logCPM. Genes selected as differentially expressed are shown as red dots. The blue lines indicate 1.5-fold changes.
