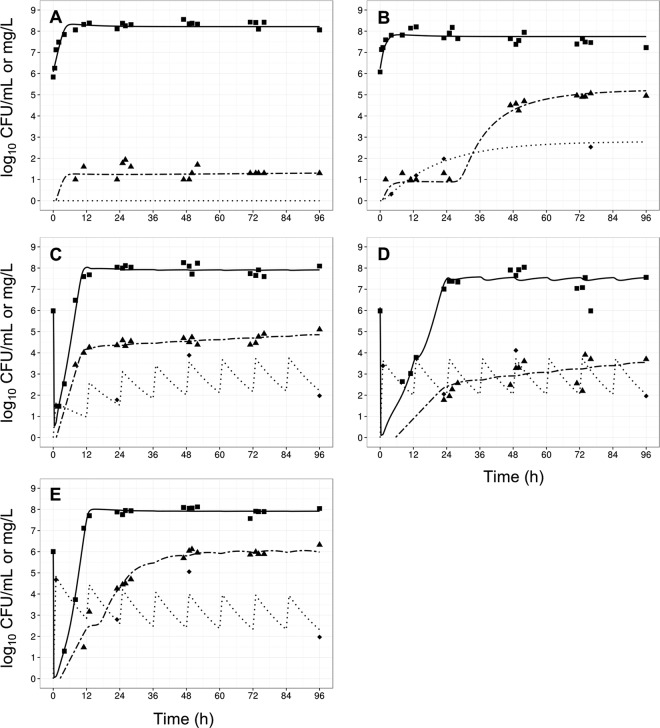
FIG 4.
Observed data (points) and individual model fits (lines) for total viable bacteria (■ and thick solid line), resistant bacteria (▲ and thick dashed line), and polymyxin concentrations (◆, dotted line) for control (A), gradual rise of colistin (R1) (B), polymyxin B with no loading dose (R2) (C), a conventional loading dose (R3) (D), and augmented loading dose (R4) (E) against A. baumannii strain AB307-0294.

