Figure 2.

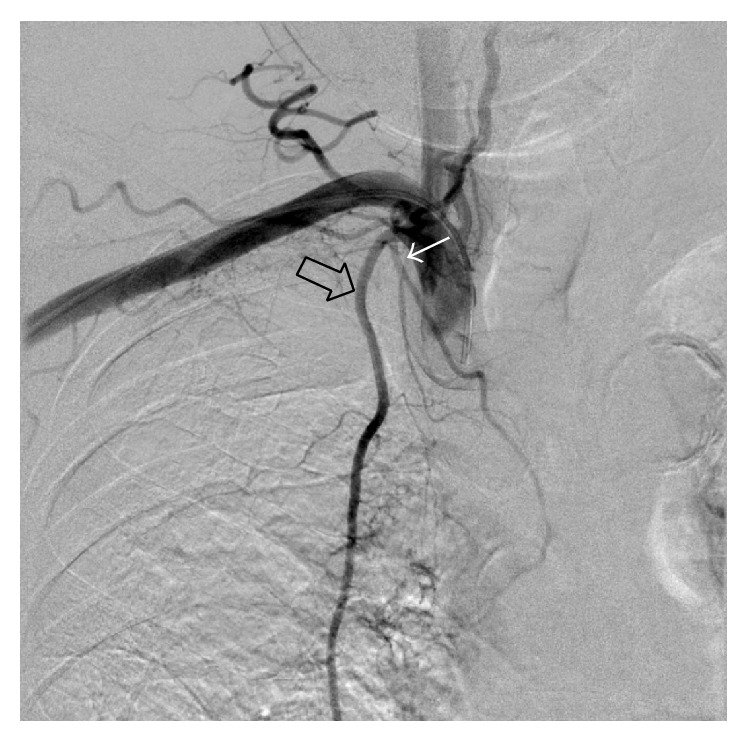
Angiogram of the brachiocephalic artery shows the hypertrophic aberrant bronchial artery (white arrow) arising from the proximal portion of the right internal mammary artery (black arrow), findings that corresponded with the CTA image.

Angiogram of the brachiocephalic artery shows the hypertrophic aberrant bronchial artery (white arrow) arising from the proximal portion of the right internal mammary artery (black arrow), findings that corresponded with the CTA image.