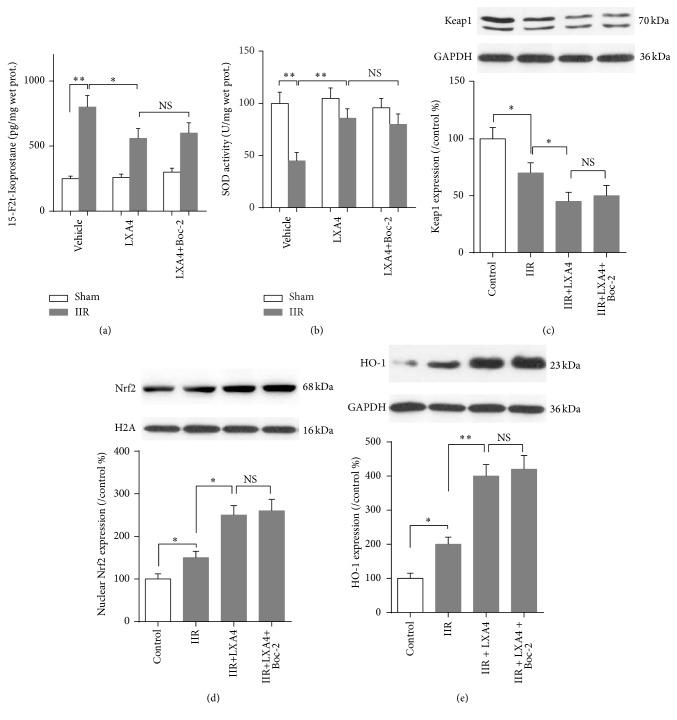
Figure 3.
Effects of Lipoxin A4 on Keap1/Nrf2 pathway. Quantitative analysis using ELISA method was taken to assay the concentration of oxidative marker 15-F2t-Isoprostane (a) and SOD activity (b) in intestine mucosa. Representative Western blots and quantitative analyses showing total Keap1 (c) and HO-1 (d) protein and nuclear Nrf2 (e) protein expressions in intestine mucosa. Each bar represents the mean ± SEM (n = 6 per group). ∗ p < 0.05, ∗∗ p < 0.01, one-way ANOVA with Tukey test. NS means no significant difference.

