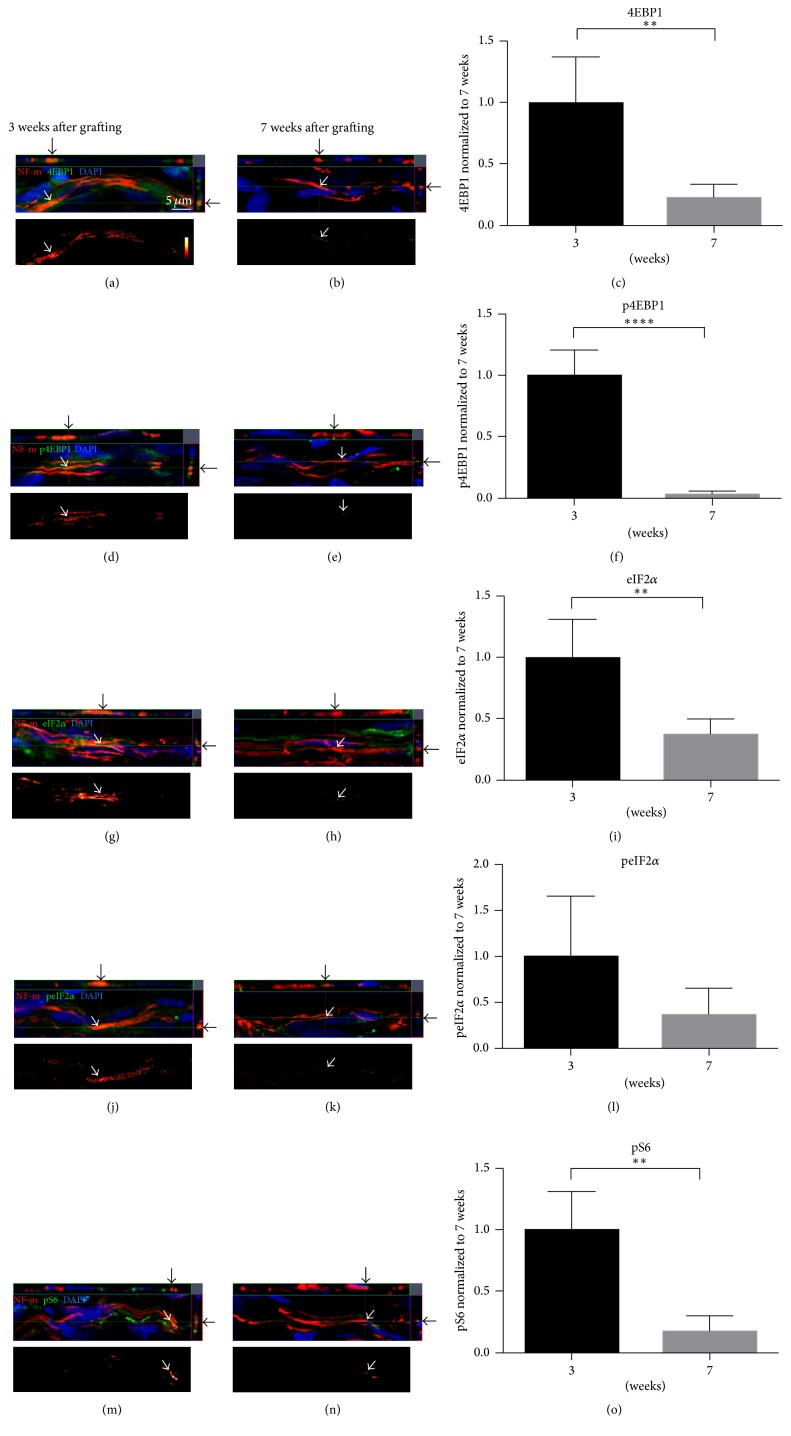
Figure 2.
Intra-axonal PSM is downregulated when axonal growth “stalls.” Representative confocal images from ascending CNS axons immunolabeled for NF-m (red) in PNGs at 3 weeks (a, d, g, h, and m) and 7 weeks (b, e, h, k, and n). The image sets colabeled for 4EBP1 (a, b), p4EBP1 (d, e), eIF2α (g, h), peIF2α (j, k), and pS6 (m, n) are shown. Top panel of each image set represents exposure matched orthogonal projections showing XY, XZ, and YZ planes indicating axon-specific signal (arrows). Bottom panel of each image set shows the subtracted image with axon-only signal (see Section 2.4 for details) for each specific protein as indicated by an intensity spectrum. These projections were generated from 8 to 10 optical sections with 0.3 μm z-step intervals. Scale bar = 5 μm. Graphs (c), (f), (i), (l), and (o) show quantification of relative immunolabeling intensity for the subtracted axon-only signals for 4EBP1, p4EBP1, eIF2α, peIF2α, and pS6, respectively. Data are expressed as fold change in signal intensity compared with 3-week grafts ± SD. ∗ p ≤ 0.05, ∗∗ p ≤ 0.01, and ∗∗∗∗ p ≤ 0.001, using Holm-Šídák post hoc test.

