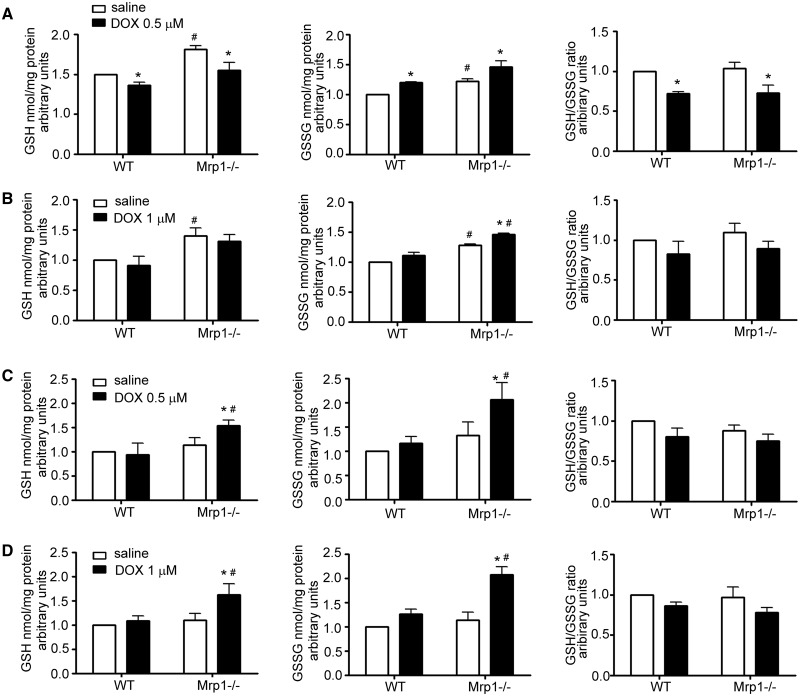
FIG. 5.
Effects of DOX on the concentration of GSH, GSSG, and the GSH/GSSG ratio in CM and CF. CM (A) and CF (B) were treated with saline or DOX (CM, 0.5 µM; CF, 1 µM) for 15 min, and GSH and GSSG measured by HPLC. CM (C) and CF (D) were treated with saline or DOX (CM, 0.5 µM; CF, 1 µM) for 3 h, the medium removed and cells incubated in fresh medium for another 24 h, and GSH and GSSG measured by HPLC. Each bar represents the mean ± SD (n = 3; *P < .05 DOX vs saline of the same genotype; #P < .05 Mrp1−/− vs respective WT cells by Newman-Keuls multiple comparison test after 1-way ANOVA).

