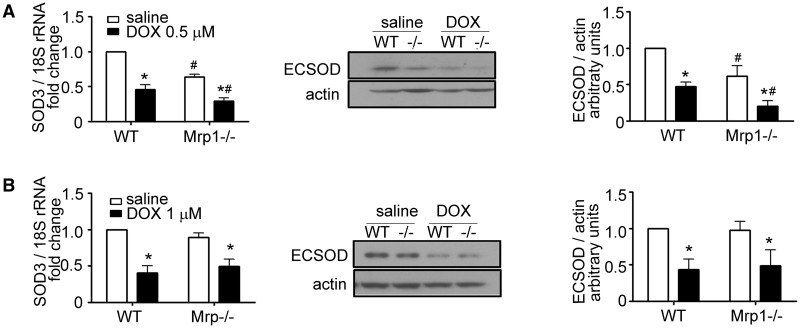
FIG. 7.
Quantitative analysis of SOD3 mRNA and protein expression in DOX-treated CM and CF. CM (A) and CF (B) were treated with saline or DOX (CM, 0.5 µM; CF, 1 µM) for 3 h, the medium removed and cells incubated in fresh medium for another 24 h. The immunoblots are representative of 1 of 3 independent experiments. Each bar represents the mean ± SD. (*P < .05 DOX vs saline of the same genotype; #P < .05 Mrp1−/− vs respective WT cells by Newman-Keuls multiple comparison test after 1-way ANOVA).

