
Figure 1. Percentage of live cells in a multispecies biofilm over time.
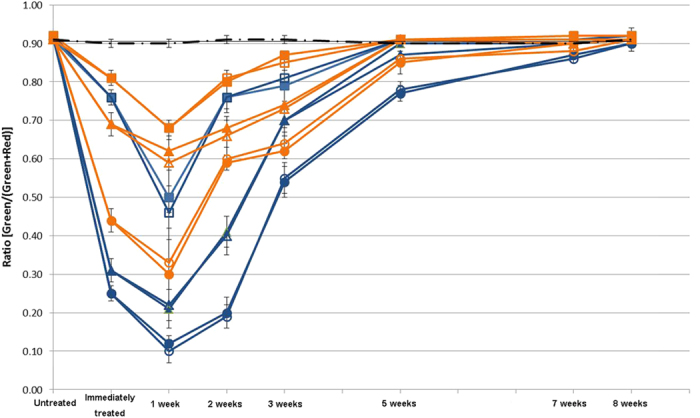
A 3-week-old biofilm was treated for 1, 3 and 10 minutes with the compounds indicated in the graph, respectively. The y-axis ratio corresponds to [live bacteria/(total bacteria)]. Two microliters of inactivator were added for 60 seconds immediately after each  treatment. (— • — No Treatment,
  CHX 1 minute with inactivator,
  CHX 1 minute without inactivator, CHX 3 min with inactivator,
  CHX 3 minutes without inactivator,
  CHX 10 min with inactivator,
  CHX 10 min without inactivator;
  CHX-Plus 1 minute with inactivator,
  CHX-Plus 1 minute without inactivator,
  CHX-Plus 3 minutes with inactivator,
  CHX-Plus 3 minutes without inactivator,
  CHX-Plus 10 minutes with inactivator, ○ CHX-Plus 10 minutes without inactivator).