
Figure 4. Serum miRNAs and mCK expression in treated mice.
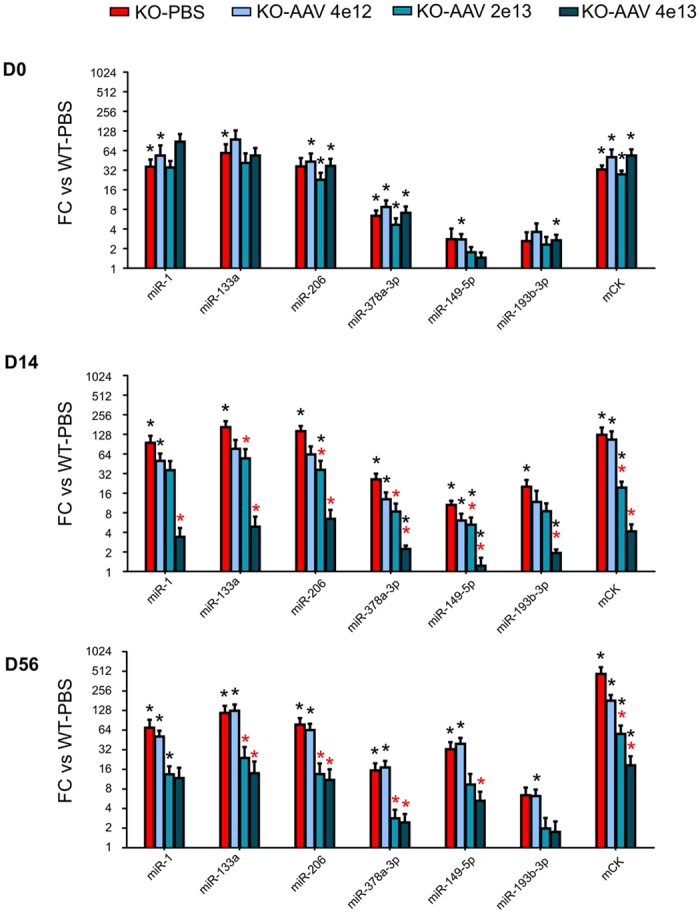
MiRNA expression was assessed in the serum of gene-therapy treated KO-Sgca dystrophic and healthy control mice, before injection at day zero (D0, upper panel), and after gene therapy by the indicated vector dose, at 14 and 56 days post injection (D14, and D56, middle and lower panels), miRNAs and mCK expressions are presented as fold change (FC) relative to the control C57Bl/6 healthy mouse (WT-PBS). Red and black asterisks designate significant differences compared to untreated KO-Sgca (KO-PBS) and to healthy WT control (WT-PBS) mice, respectively. All FC and p values are shown in Supplemental Tables ST4 (D0), ST5 (D14) and ST6 (D56). Note that at D0 (upper panel) all mice are as yet untreated, and the variations in miRNAs FC and p values between viral-dose groups reflect experimental variations.