
Figure 5. Muscle miRNA expression in treated mice.
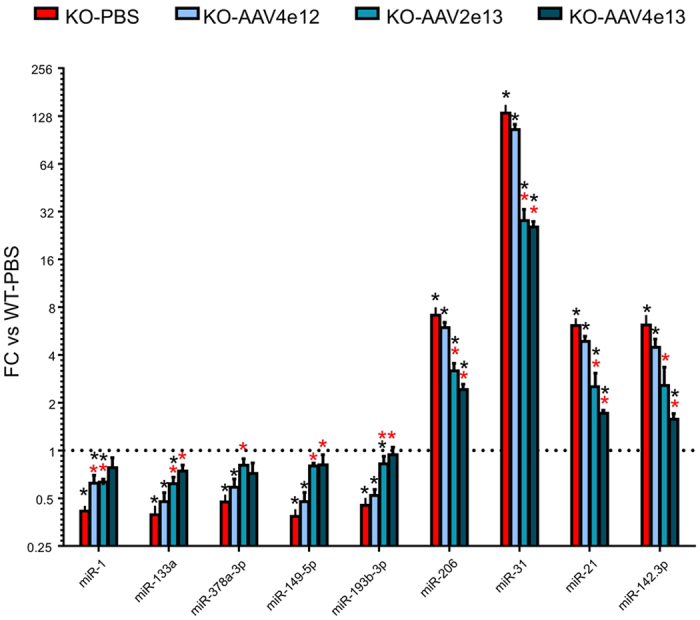
MiRNA expression was assessed in the Ga muscle of the KO-Sgca dystrophic mice, 3 months after transgene delivery, with the indicated viral dose and presented as FC relative to the control C57Bl/6 healthy (WT-PBS) mouse. Red and black asterisks designate significant differences compared respectively to untreated KO-Sgca (KO-PBS) and to healthy WT control (WT-PBS) mice. All FC and p values are shown in Supplemental Table ST7.