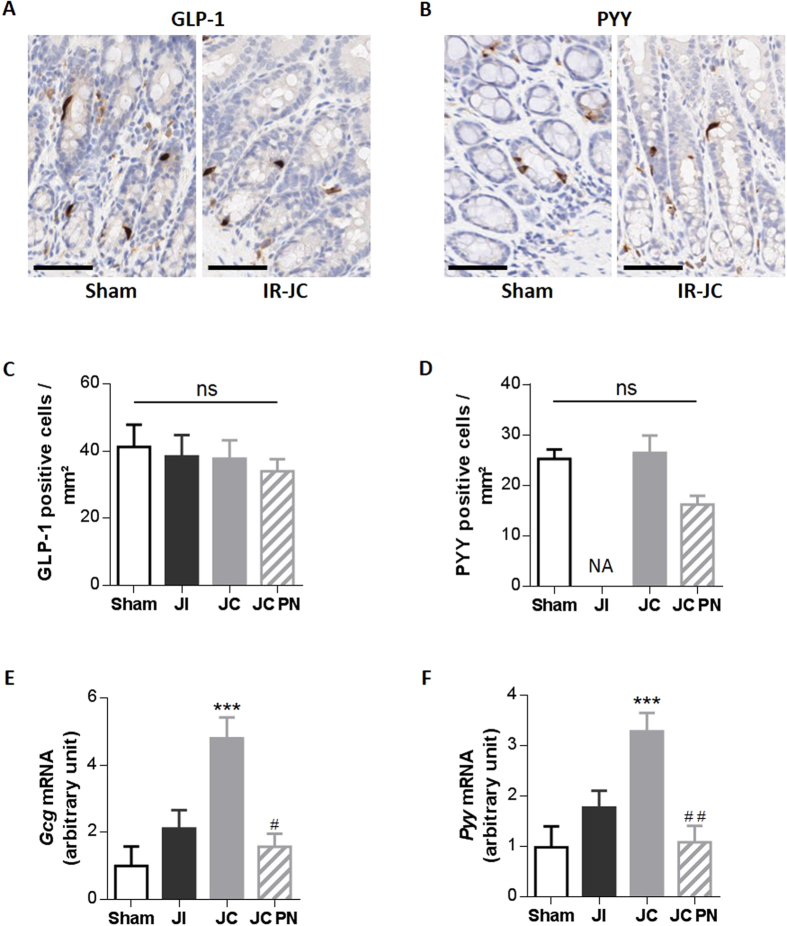
Figure 4. Unchanged number of PYY and GLP-1 positive cells but enhanced levels of proglucagon and Pyy mRNA after intestinal resection in rats.
(A,B) Representative photomicrographs of GLP-1 (A) and PYY (B) immunostaining on colon mucosa sections from sham-operated and IR-JC rats (cytoplasm of GLP-1 or PYY cells are stained in brown), scale bar:50 μm. (C,D) Quantification of GLP-1 (C) and PYY (D) positive cells per area in mm2. Data are represented as mean ± SEM of n = 4 for sham, n = 4 or not available (NA) for IR jejuno-ileal (JI), n = 5 for IR jejuno-colonic (JC), n = 6 for for IR jejuno-colonic with PN (JC-PN). (E–F) Colonic mucosa mRNA levels of proglucagon (Gcg) (E) and Pyy (F) normalized to L19, 7 days after surgery. Data are represented as mean ± SEM of n = 6 for sham, n = 5 for IR-JI, n = 9 for IR-JC, n = 6 for IR-JC with PN. *P < 0.05, **P < 0.01, ***P < 0.001 vs sham-operated rats and #P < 0.05 ##P < 0.01 vs IR-JC based on non-parametric Kruskal-Wallis test followed by Dunn’s adjusted multiple comparisons.

