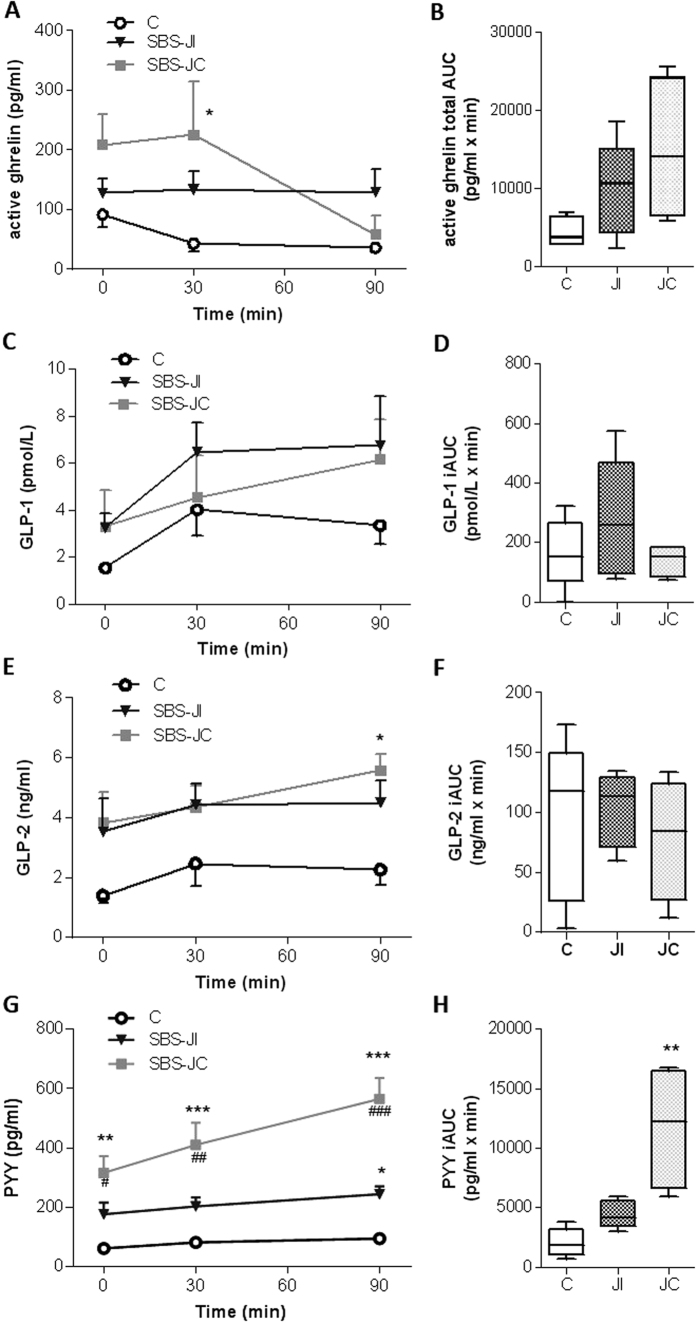
Figure 6. Increased fasting and post-prandial levels of plasma active Ghrelin, GLP-1, GLP2 and PYY in SBS patients.
Plasma concentrations and secretory response to a calibrated meal (750 kcal) in SBS jejuno-ileal (JI) and SBS jejuno-colonic (JC) patients compared to healthy subjects (C) of: (A,B) active ghrelin (pg/mL) before (T0) and after (T30, T90) the meal (A) and ghrelin secretory response expressed as the total area under the curve (AUC) (B) GLP-1 (pg/mL) before (T0) and after (T30, T90) the meal (C) and GLP-1 secretory response expressed as the incremental area under the curve (iAUC) (D); (E,F) GLP-2 (pg/mL) before (T0) and after (T30, T90) the meal (E) and secretory response expressed as the iAUC (F PYY (pg/mL) before (T0) and after (T30, T90) the meal (G), and secretory response expressed as the iAUC (H). All values are expressed as the mean ± S.E.M of n = 5 for healthy subjects, n = 5 for jejuno-ileal SBS patients and n = 4 for jejuno-colonic SBS patients. *P < 0.05, **P < 0.01, ***P < 0.001 vs healthy subjects and #P < 0.05, ##P < 0.01 and ###P < 0.001 vs jejuno-ileal SBS patients based for A, C, E, G, on Bonferroni’s multiple comparisons test and for B, D, F, H on non-parametric Kruskal-Wallis test followed by Dunn’s adjusted multiple comparisons.

