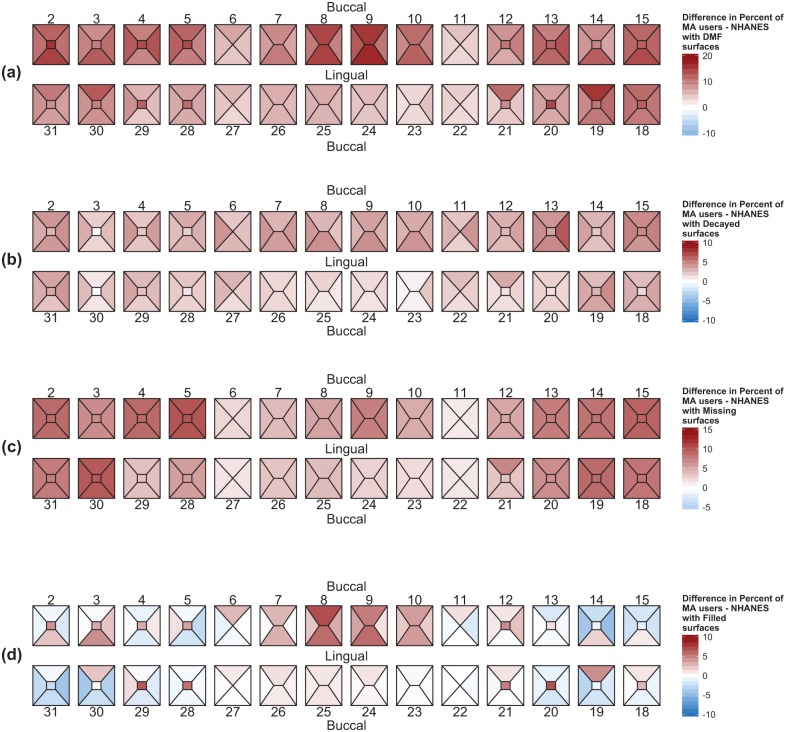
Figure 3.
Graphical summary of diseased, missing, and filled tooth surfaces. Polygons for each tooth surface characterize the differences in the proportions of DMF (a), decayed (b), missing (c), and filled (d) surfaces between MA users and NHANES subjects. The range and intensity of the color map reflect the magnitude and direction of the differences in proportions of afflicted surface in the MA users (red) or NHANES subjects (blue).

