
Figure 2.
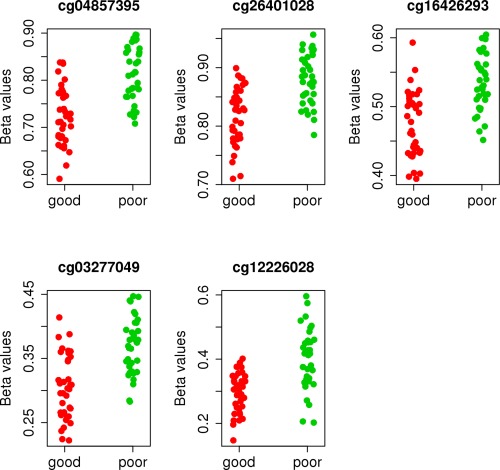
Plot of CpG methylation values for the top 5 differentially methylated positions in both good responders and poor responders (i.e., nonresponders). Color figure can be viewed in the online issue, which is available at http://onlinelibrary.wiley.com/journal/doi/10.1002/art.39590/abstract.