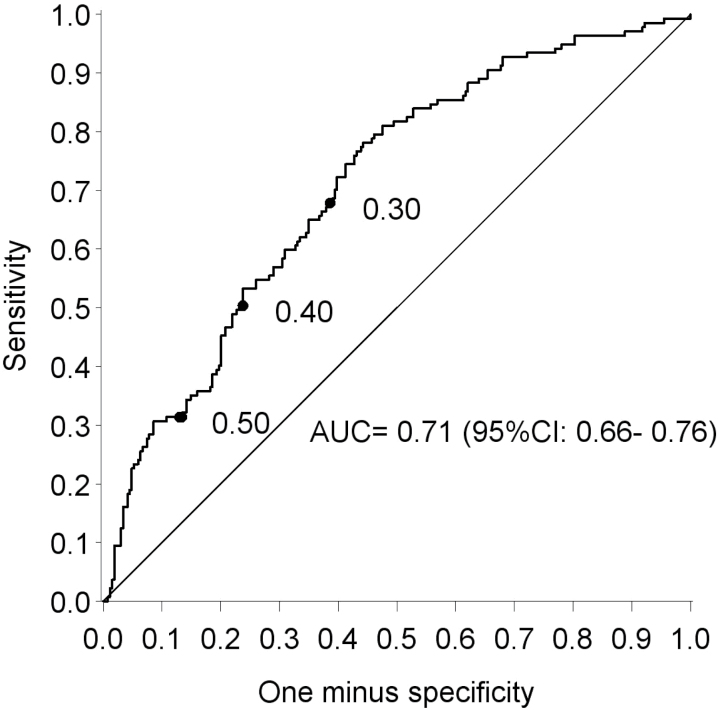
Figure 3.
The ROC-curve of the final multivariable model. This curve presents the sensitivity and (one minus) specificity of all possible classifications using different cut-offs for the (cross-validated) predicted probability of root resorption. As an illustration, three cut-offs for the probability are labeled.

