
Figure 1.
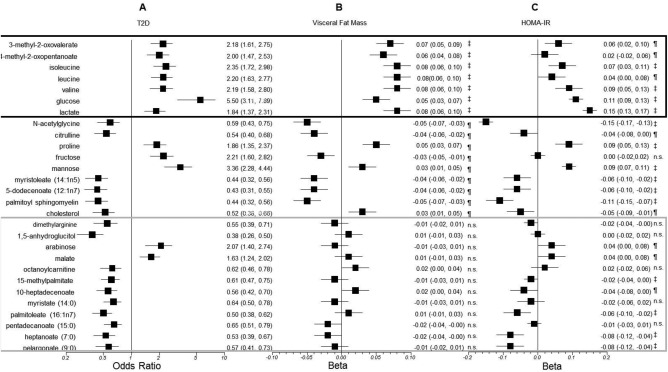
Association of selected metabolites with (A) T2D, (B) visceral fat mass, and (C) homeostasis model assessment‐estimated insulin resistance (HOMA‐IR). The metabolites are those previously reported to be associated with T2D with P < 0.0001. The odds ratio with T2D and the coefficients β and the 95% confidence intervals of the linear regression with visceral fat mass and log HOMA‐IR adjusted for covariates are shown for each metabolite. P values are ‡P < 0.0001, ¶0.0001 < P < 0.05, and n.s. P > 0.05.