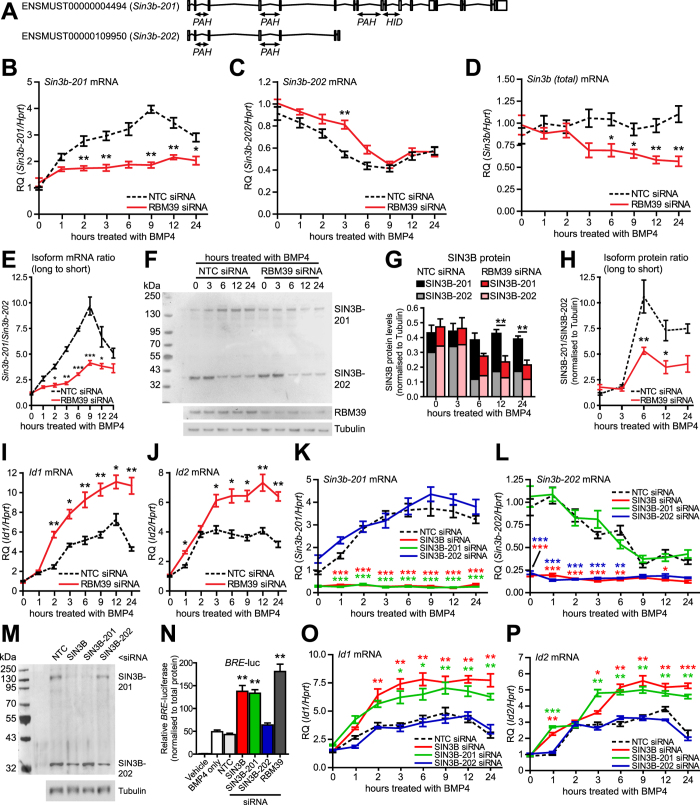
Figure 2. Expression of alternative Sin3b splice isoforms in mouse C2C12 cells; effect of knockdown of specific isoforms on BMP4-dependent transcription.
(A) Mouse Sin3b is alternatively spliced as one of two isoforms. Translated Sin3b-201 contains both paired amphipathic helix (PAH) and histone deacetylase interacting (HID) domains. Sin3b-202 contains only PAH domains. C2C12 cells were transfected with either RBM39 siRNA or non-target control (NTC) siRNA for 24 hours followed by treatment with BMP4. (B–D) Sin3b-201, Sin3b-202 and total Sin3b qPCR. Y-axis shows relative expression (RQ, mean +/− S.E.M., n = 3) normalised to Hprt. *P < 0.05, **P < 0.01, versus NTC at same timepoint. (E) Ratio of Sin3b mRNA levels. Y-axis shows averaged ratio for n = 3 experiments (mean +/− S.E.M) *P < 0.05, **P < 0.01, ***P < 0.001, versus NTC at the same timepoint. (F) Expression of SIN3B in C2C12 cells. Representative blot for n = 3 experiments shown. (G) Quantification of SIN3B isoforms. Y-axis shows expression normalised to tubulin. **P < 0.01. (H) Ratio of SIN3B-201 to SIN3B-202. Y-axis shows averaged ratio for n = 3 experiments (mean +/− S.E.M.). *P < 0.05, **P < 0.01, versus NTC at the same timepoint. (I,J) Id1 and Id2 qPCR. Y-axis shows relative expression (RQ, mean +/− S.E.M., n = 3) normalised to Hprt. *P < 0.01, **P < 0.01, versus NTC siRNA at same timepoint. (K,L) Sin3b-201 and Sin3b-202 qPCR. Cells were transfected with siRNA to total SIN3B, SIN3B-201 or SIN3B-202 for 24 hours, followed by treatment with BMP4. Y-axis shows relative expression (RQ, mean +/− S.E.M., n = 3) normalised to Hprt. *P < 0.05, ***P < 0.001, versus NTC at the same timepoint. (M) Expression of SIN3B in C2C12 cells. Cells were transfected with siRNA for 48 hours. Representative blot of n = 2 experiments. (N) C2C12 BRE-luc cells were transfected with siRNA for 24 hours, followed by treatment with BMP4 for 24 hours. Y-axis shows relative BRE-luciferase (mean +/− S.E.M., n = 3). **P < 0.01 versus NTC. (O,P). Id1 and Id2 qPCR. Cells were transfected with siRNA for 24 hours, followed by treatment with BMP4. Y-axis shows relative expression (RQ, mean +/− S.E.M., n = 3) normalised to Hprt. *P < 0.05, **P < 0.01, ***P < 0.001, versus NTC at the same timepoint.

