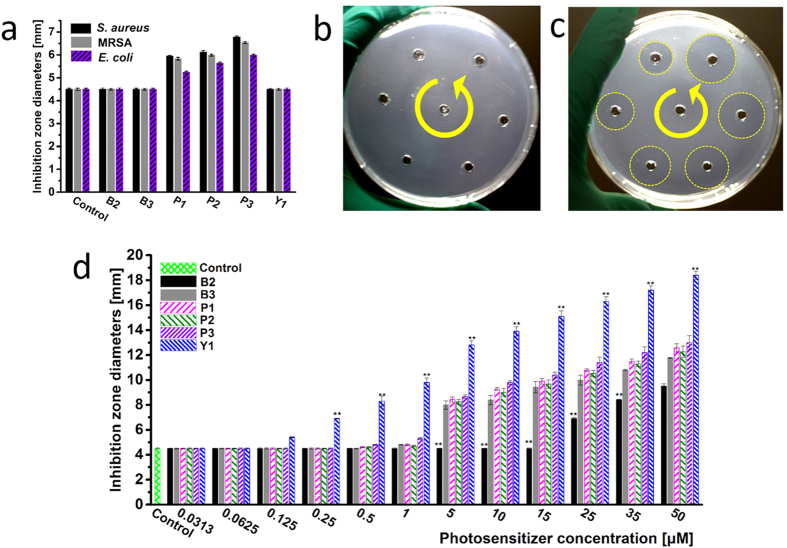
Figure 2. The data of inhibition zone diameters with different PSs at different concentrations.
(a) PSs against all strains in dark with a concentration of 10 μM. Image of Y1 against MRSA at different concentrations of 5, 10, 15, 25, 35, and 50 μM, respectively, (b) In dark, (c) With a 532 nm laser (50 mW cm−2, 10 min, 30 J cm−2). (d) PSs against MRSA with a 532 nm laser (50 mW cm−2, 10 min, 30 J cm−2) at different concentrations. (**P < 0.05 compared with the corresponding data of other PSs).

