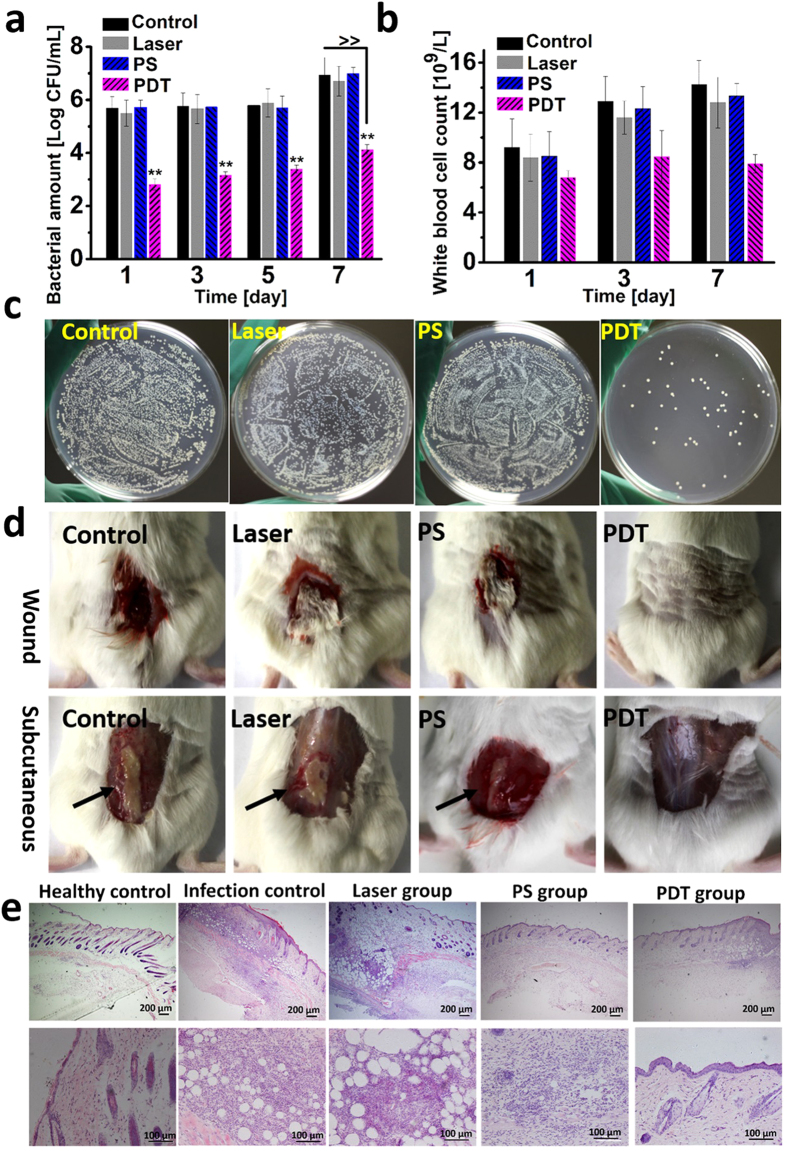
Figure 4.
(a) Bacterial amount of the control, laser, PS, and PDT group at different days after treatment, data of days 1, 3, and 5 were obtained by isolating MRSA from the mice skin. ≫means the data were acquired from tissue serous (0.01 g/mL) on the 7th days, “**” indicates statistical significance relative to the control group, p < 0.05. (b) The white blood cell count (WBC) of different groups at different days after PDT treatment. (c) Plate photographs of bacterial amount of tissue serous (0.01 g/mL), 100-fold dilution respectively. (d) The wound healing results and the subcutaneous tissue infection results of the control, laser, PS, and PDT groups after 7 days of treatments. (e) Histological analysis of tissues in healthy control, infection control, laser, PS, and PDT groups.

