
Figure 5. Raman spectra of GO treated E. coli; (control-black line) and different GO concentrations (50 μg/mL-red line, 100 μg/mL-green line, and 150 μg/mL-blue line).
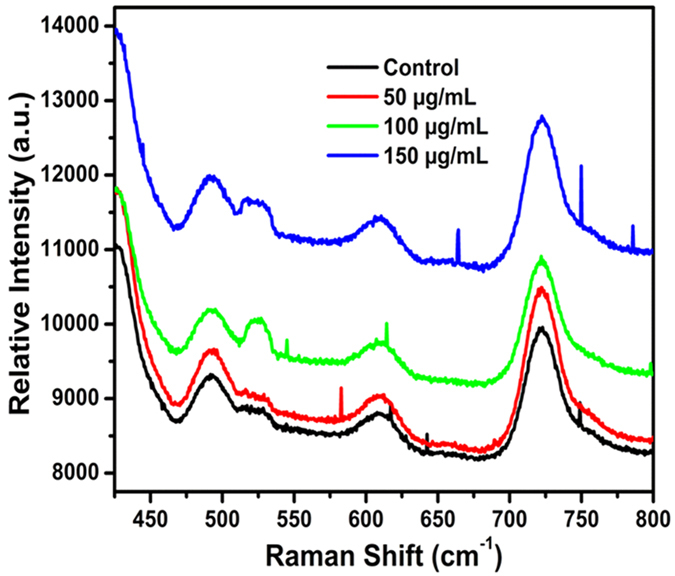
The data show an increment of Adenine (729 cm−1), and proteins (S-S stretching vibration at 490 cm−1 and Amide VI band at 610 cm−1) concentration in E. coli when GO concentration increases.