
Figure 2. The novel interaction between Asp757 and Arg762 in the activation segment of the autoinhibited EphA2 structure in comparison with the PKA structure activation segment.
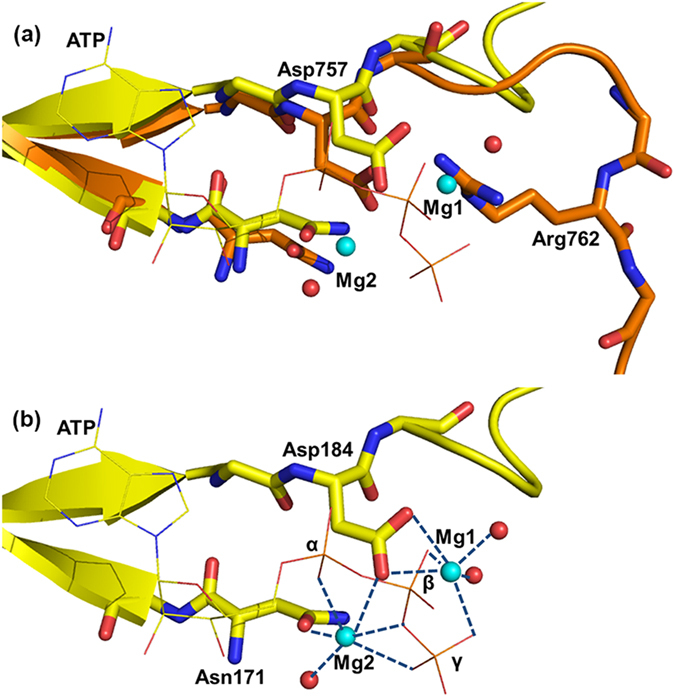
(a) Alignment of the N-terminal part of the activation segment from EphA2 and PKA. The backbone of the activation segment of EphA2 is colored in orange, and PKA is shown in yellow. ATP from the PKA structure is depicted as lines and colored by element, the coordinating water molecules are colored red, and Mg2+ ions are colored cyan. (b) View of Mg2+ coordination in PKA. Metal coordination is shown as blue dashed lines.