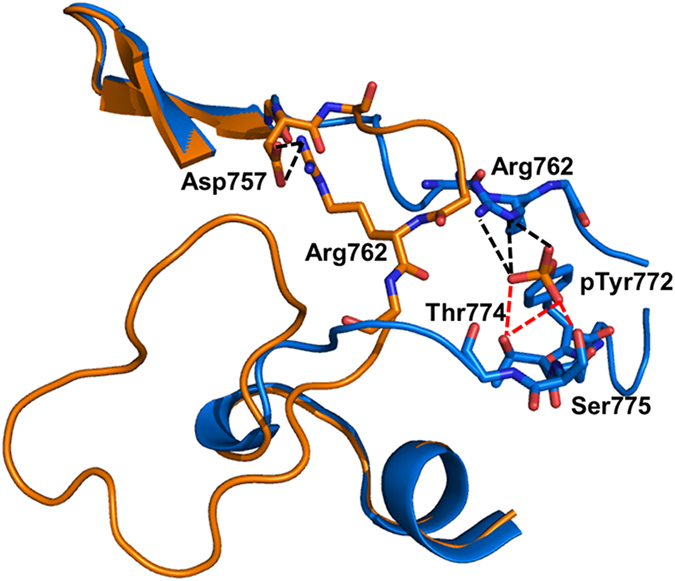
Figure 3. Alignment of the activation segment of the autoinhibited and active EphA2 (PDB 4TRL).

The backbone of the active EphA2 is colored marine. The salt-bridge interactions between the pTyr772 and Arg762 are shown as black dashed lines and the selected hydrogen-bonding interactions are shown as red dashed lines. The backbone of the autoinhibited EphA2 is colored as in Fig. 2 and the salt-bridge interactions between Asp757 and Arg762 are shown as black dashed lines.
