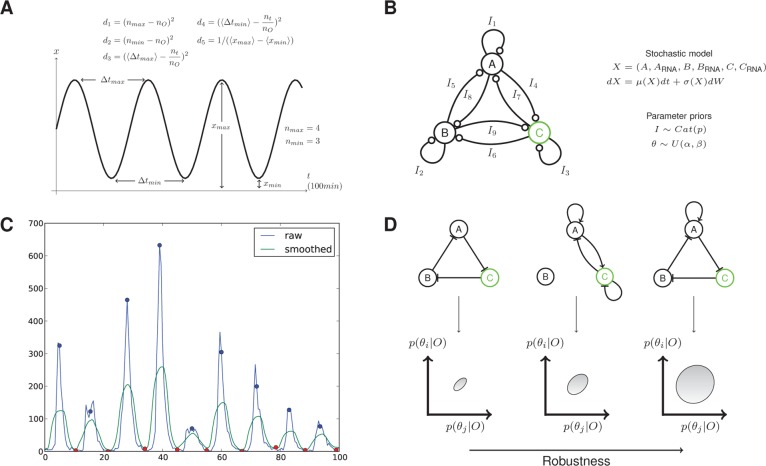
Figure 1.
Outline of the method. (A) The objective behavior is specified through a set of summary statistics and distances on the summaries (see Materials and Methods for a description of the terms). (B) Model space is defined through a fully connected network. A mapping from the graphical network to a stochastic model is defined together with a prior on the parameters and priors on the allowed networks. (C) Simple signal processing methods are used to extract features from model simulations. The blue and red circles indicate identified maxima and minima, respectively. (D) As the algorithm proceeds the (multidimensional) objective is achieved via small increments using sequential Monte Carlo. The final output of the algorithm is a set of models that satisfy the objective and maximize robustness.

