Figure 5.

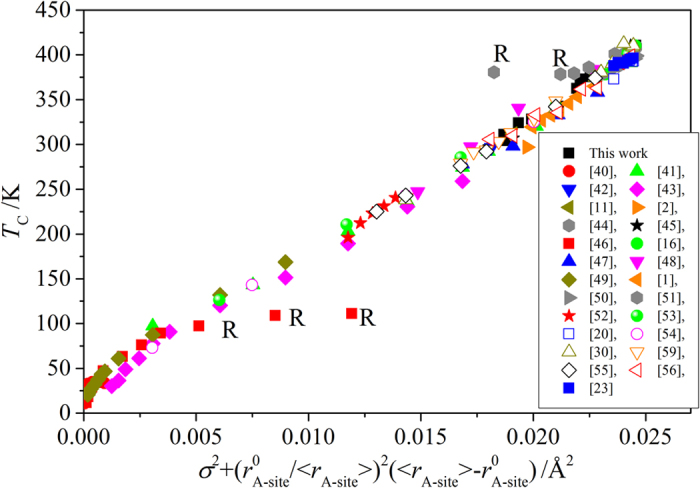
TC as a function of  for samples studied in this work and reported in the literature. R denotes samples with relaxor type behavior.

TC as a function of  for samples studied in this work and reported in the literature. R denotes samples with relaxor type behavior.