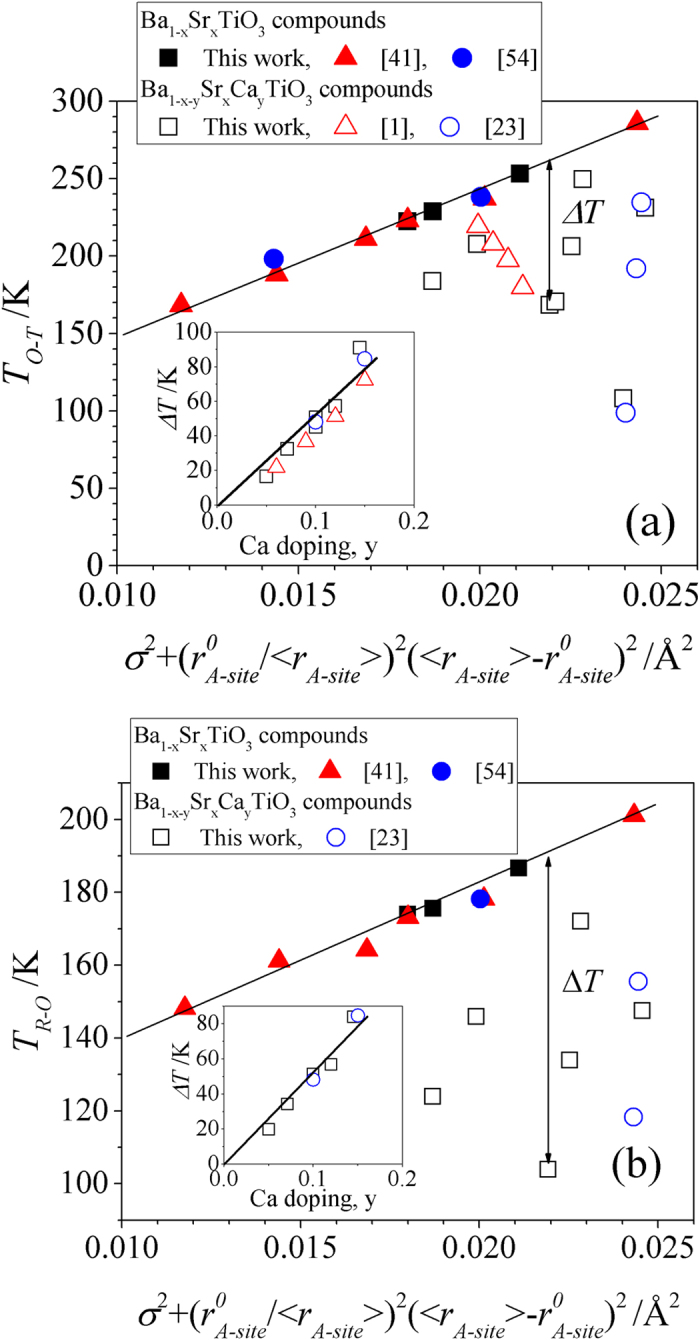
Figure 7.

Temperatures of orthorhombic to tetragonal transition, TO-T, (a) and rhombohedral to orthorhombic transition, TR-O, (b) as function of  . The temperature deviation, ΔT, of Ca containing samples (Ba1-x-ySrxCayTiO3, open symbols) from line for only Ba, Sr containing compounds (Ba1-xSrxTiO3, solid symbols). Insets show ΔT as a function of Ca doping, y. Solid lines are guides to eye.
