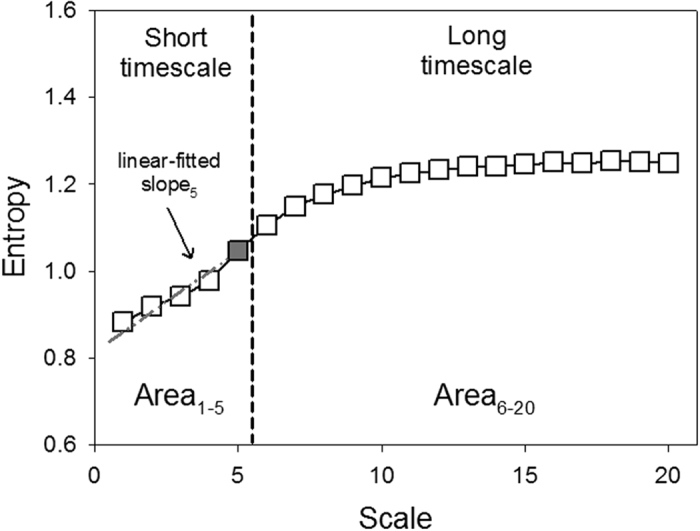
Figure 1. Quantification of MSE: Summation of the entropy over different scales can quantify the complexity over certain timescales.

Four parameters of the MSE were assessed. The first was the linear-fitted slope between scales 1–5 (slope 1–5). The second was the entropy value of scale 5 (scale 5). The area under the curve between scale 1–5 (area 1–5) was used to represent complexity between short scales. For longer scales, the common profile of entropy gradually increased as the time scale increased and reached a plateau where information richness could be accumulated rapidly if the system responded well. We used the area under curve between scale 6–20 (area 6–20) to represent complexity between long scales.
