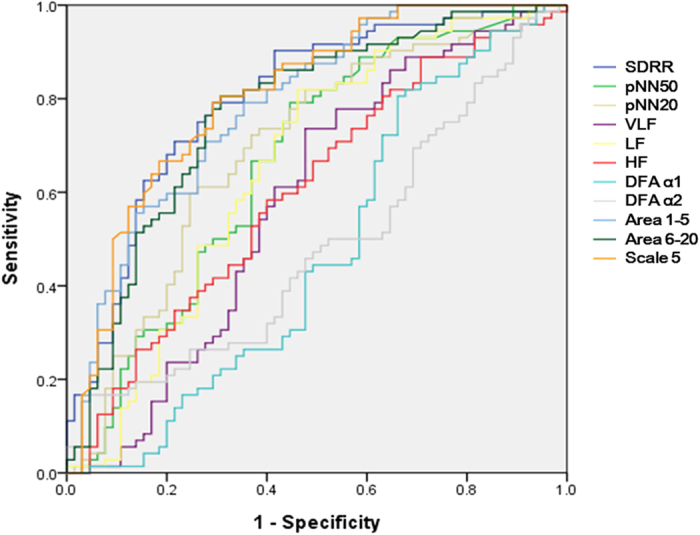
Figure 3. Analysis of the discrimination power of the two group by receiver operating characteristic curve analysis.

The areas under the curve of SDRR, pNN50, pNN20, VLF, LF, HF, DFAα1, DFAα2, slope 1–5, area 1–5, area 6–20, and scale 5 were 0.800, 0.667, 0.693, 0.584, 0.657, 0.603,0.471,0.485, 0.582, 0.786, 0.771, and 0.806, respectively.
