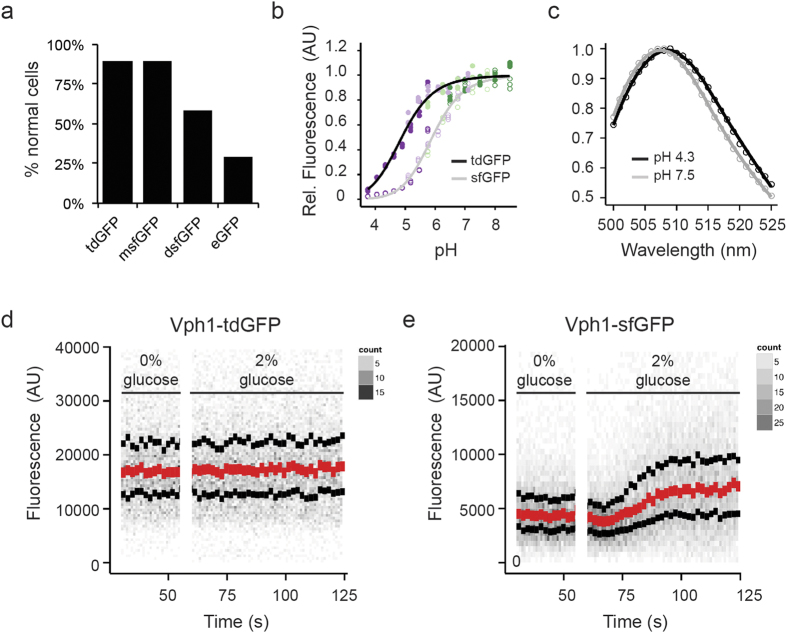
Figure 3. Characterisation of pH-tdGFP as a biomarker.
(a) Intracellular oligomerisation of pH-tdGFP was examined. Indicated GFPs fused to a C-term portion of cytochrome p450 were expressed in HEK293 cells. GFPs that oligomerise cause ‘whorl’ structures in the ER. The number of cells expressing GFP were counted and those with whorls were considered abnormal. msfGFP (monomeric sfGFP; Lys at position 206), dsfGFP (dimeric sfGFP; Ala at position 206) (b) Purified pH-tdGFP was diluted into buffers ranging in pH from 3.75–8.50 and fluorescence was measured (ex 488 nm, em 525 (5) nm). sfGFP (pKa = 5.9) is present as a reference. Colours indicate the buffer used (acetate (dark purple), MES (light purple), PIPES (light green), HEPES (dark green)). (c) Emission scans of pH-tdGFP variants excited at 488 nm were performed at pH 4.3 (black) and 7.5 (grey). Curves are plotted relative to the peak of each scan. Yeast cells expressing pH-tdGFP-tagged Vph1 (d) or sfGFP tagged Vph1 (e) were incubated in media +/− 2% glucose to examine the in vivo pH stability of pH-tdGFP. In media lacking glucose the pH drops to ~5.5 and rises to ~7.5 upon readdition of the glucose. Red dots indicate median with the upper and lower black dots indicating the quartiles. Grey dots indicate the number of cells as indicated by the heat maps.

