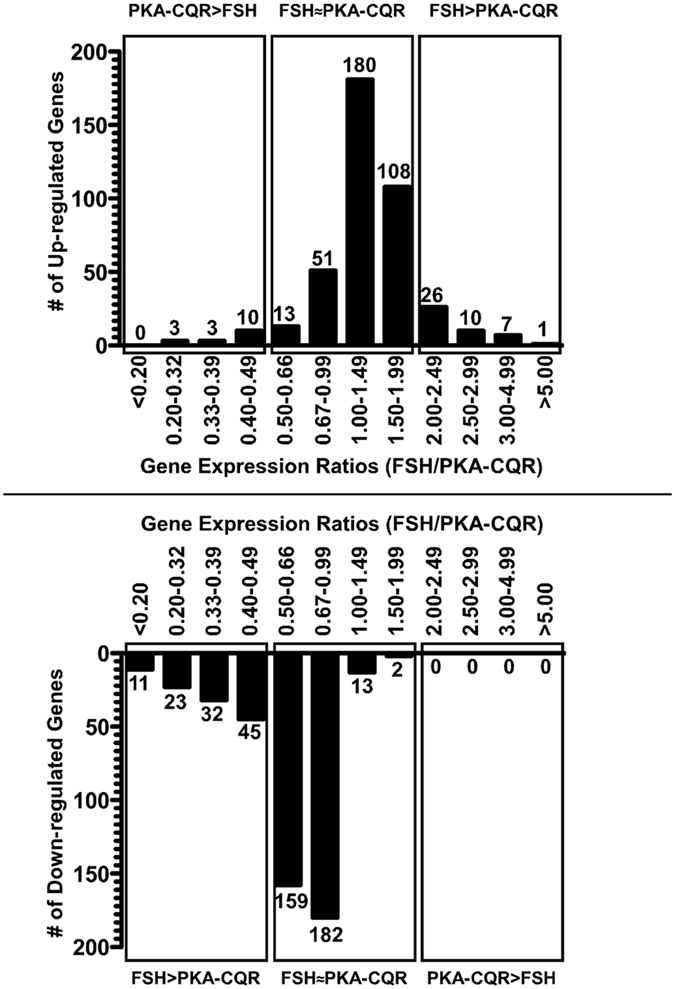
Figure 4. Comparison of gene expression profiles at 24 hr. of GCs stimulated with FSH or expressing PKA-CQR by relative gene expression ratio metric.

Transcripts up-regulated (A) or down-regulated (B) at least 2-fold by FSH or PKA-CQR were identified by dividing the expression values of individual transcripts in the FSH or PKA-CQR groups (n = 3) with the corresponding expression values of the respective transcript levels in the control groups (n = 2). To determine the up-regulated and down-regulated transcripts for the third group, the average of control values of group 1 and group 2 were used. For transcripts altered 2-fold or more by either FSH or PKA-CQR, relative expression change ratios were calculated by dividing the fold-change of each transcript in the FSH group by the fold change of that transcript in the PKA-CQR group. The ratios were categorized into the indicated ranges and the number of up-regulated (A) or down-regulated genes (B) that fell into each range was determined. Transcripts with less than 2-fold difference between FSH and PKA-CQR were considered similarly regulated by FSH and PKA-CQR (FSH~PKA).
