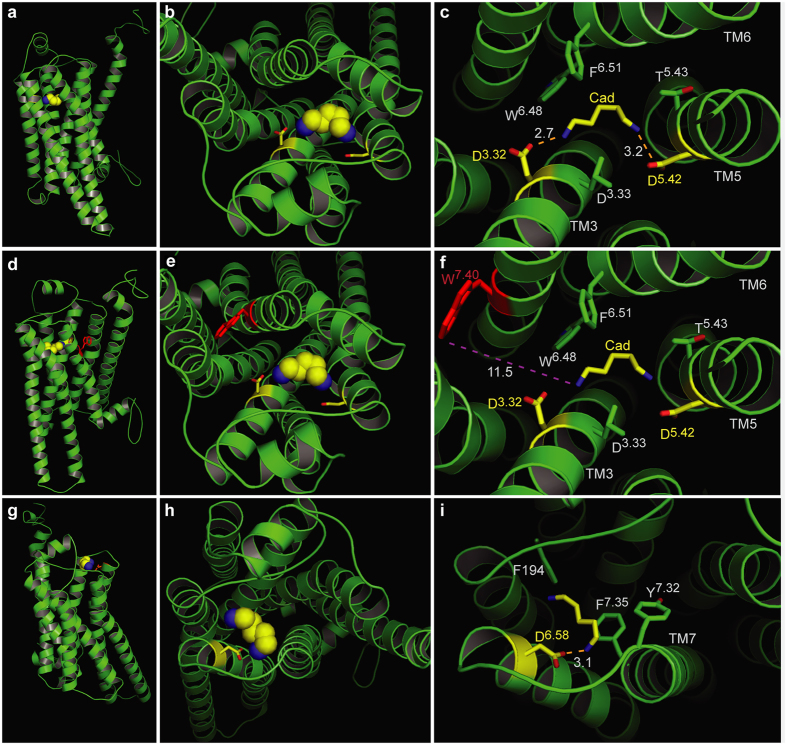
Figure 2. Two binding sites for cadaverine predicted by docking to wildtype TAAR13c.
TAAR13c structure (green) is shown with cadaverine (cad; yellow, backbone; blue, amino groups) and coordinating aspartate residues (yellow, backbone; red, carboxyl group). (a) Sideview of TAAR13c shows spatial position of cadaverine docked to the internal binding site, located in the external third of the TM region. (b) Enlarged view from the extracellular surface onto the same binding site shown in panel (a). (c) Enlargement from panel (b) (same view) showing cadaverine, the major interacting residues and the distances in Å from the carboxyl groups of aspartates D3.32 and D5.42 to the amino groups of cadaverine. Salt bridges are visualized as orange dashed lines. (d) Side view (turned about 90° compared to panel (a) shows the side chain of W7.40 located away from the predicted binding site. (e) View from the extracellular surface, enlarged, same orientation as panel (b). W7.40 is positioned on the distal side of its TM relative to the binding site. (f) Enlargement from panel (e) (same view) showing cadaverine, the two interacting aspartate residues and the large distance to the side chain of W7.40 (purple dashed line), which is thus unlikely to participate in binding interactions. (g) Side view (turned about 90° compared to panel (a) showing cadaverine bound at an additional binding site on the external surface. (h) View onto the extracellular surface, enlarged, orientation turned 180° relative to panel (b). A single aspartate (D6.58) coordinates cadaverine. (i) Enlargement from panel (h) (similar view) showing cadaverine, the major interacting residues and the distance from the carboxyl group of D6.58 to the amino group of cadaverine. The salt bridge is visualized as orange dashed line.

