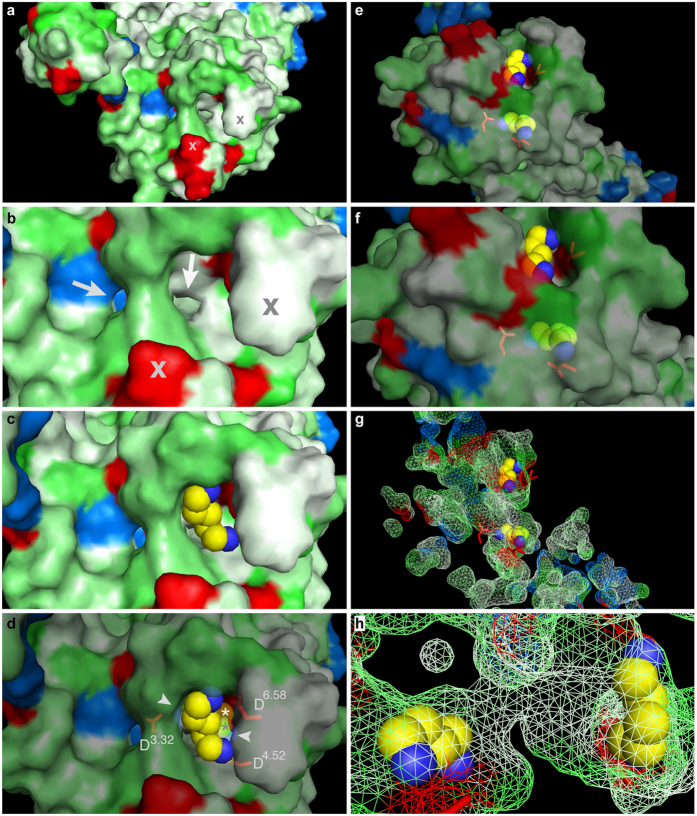
Figure 5. Occupied external binding site blocks access of cadaverine to the interior binding and activation site.
Surface view (panels a–f) and mesh view (panels g,h) of the TAAR13c model docked with cadaverine visualizes a potential access path for cadaverine. (a) View from the extracellular surface; red, acidic residues; blue, basic residues; green, polar residues; white, hydrophobic residues; cross, same protrusions as marked in panel (b). (b) Enlarged detail of panel a; arrows point to two potential access paths for passage of cadaverine to the internal binding site. Note that the positively charged Arg922.64 precludes access via left route. (c) Cadaverine docked into the external binding site, same view as in panel b. Note that the access to the internal binding site is blocked. (d) Same view as panel (b,c), but partly transparent; aspartates of external (D6.58) and internal (D3.32 and D4.52) binding sites are shown in stick mode; asterisks mark cadaverine bound to the internal binding site; arrowheads point to the amino groups of cadaverine docked into the internal binding site, which lies right below the external binding site shown in top view. (e) Slightly tilted view onto the external surface to display both binding sites at once, external binding site is up. Partial transparency visualizes cadaverine docked into the internal binding site, down; aspartates of external and internal binding sites are shown in stick mode, red. (f) Enlargement of panel (e). (g) Same orientation and magnification as in panel e; mesh view of all predicted cavities, with cadaverine docked into the external and internal binding site. (h) Enlarged view turned 90° counter clockwise and 90° front-to-back compared to panel (g). Note the tunnel connecting the external (left) and internal (right) binding site.

