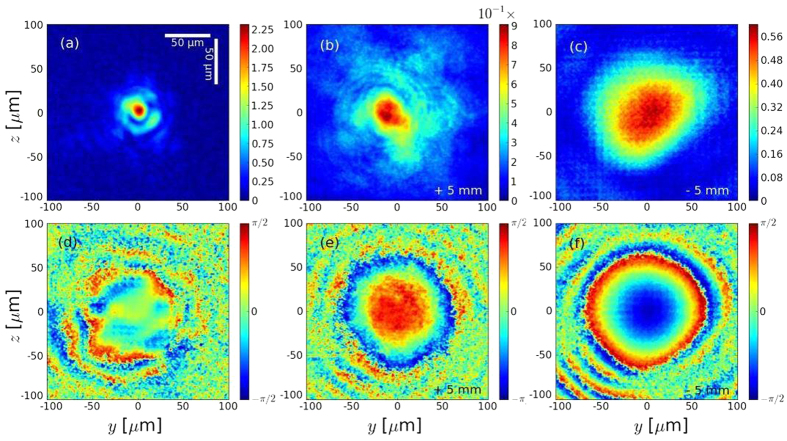
Figure 1.
(a,b) are the laser spots (normalized potential vector) measured experimentally at the focal plane and 5 mm after respectively. (d,e) are the phases reconstructed with the GSA corresponding to (a,b) respectively. Figure (c) (resp. (f )) shows a0 for the focal spot (resp. the phase) of the laser 5 mm before the focal plane and calculated with the GSA.

