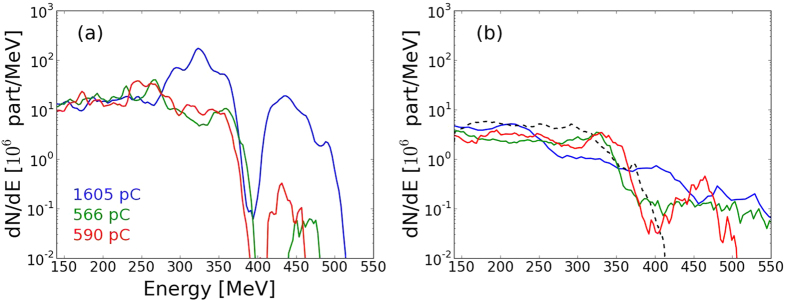
Figure 5.
(a) (resp. (b)) Electron distribution for the 5 mm nozzle after 3.5 mm (resp. 6.6 mm) of propagation. In blue, with a gaussian laser, in green with the experimental spot only and in red with the experimental spot and phase. In dashed black line, the experimental electron energy spectrum (averaged over ten shots).

