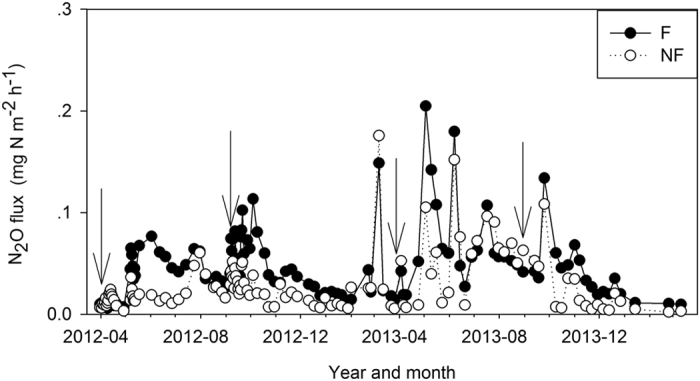
Figure 4. Area weighted mean N2O fluxes from the fertilized and unfertilized treatments during the observation period.

A black circle indicates the area-weighted N2O flux from the fertilized treatment. An empty circle indicates the area weighted mean N2O flux from the unfertilized treatment. The arrow indicates the date of fertilization.
