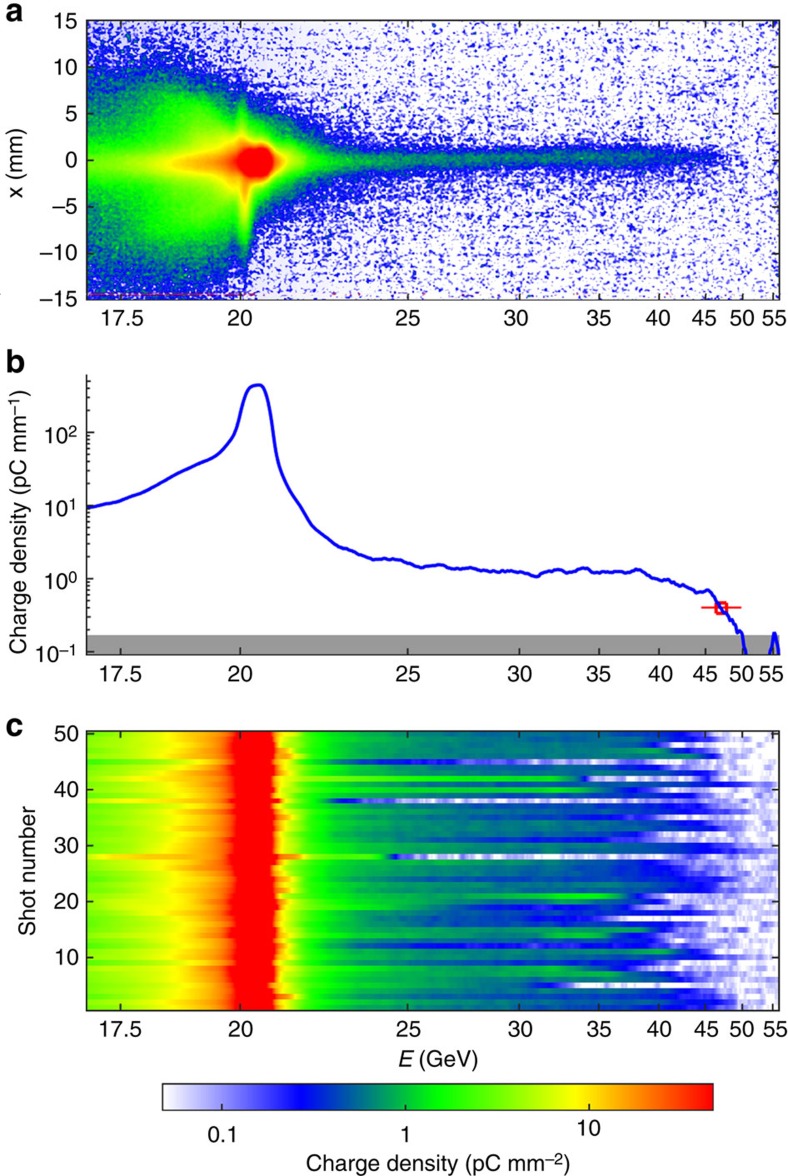
Figure 2. Electron energy spectra.
(a) Single shot image of the electron energy spectrum measured by the Cherenkov detector (see the Methods for details). (b) Projection of the image (a) on the electron energy axis, showing a maximum energy at 47±2.5 GeV. The horizontal error bar accounts for resolution limit due to finite beam size and for error due to pointing fluctuations, and the grey area indicates the detection threshold. (c) Waterfall plot showing the peak charge density as a function of electron energy for 50 consecutive electron bunches.

