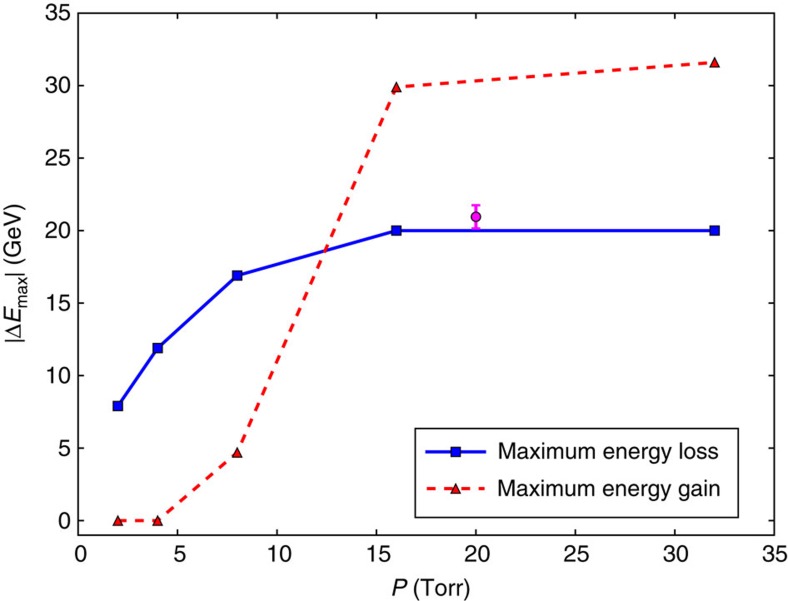
Figure 5. Energy gain and loss in simulations.
The red triangles (blue squares) represent the maximum energy gain (maximum energy loss) observed at the end of the beam-plasma interaction in QuickPIC simulations (see the Methods for details) for different argon pressures. The magenta circle and its error bar represent the experimental average maximum energy gain corresponding to the data of Fig. 2 and its s.e.m.

