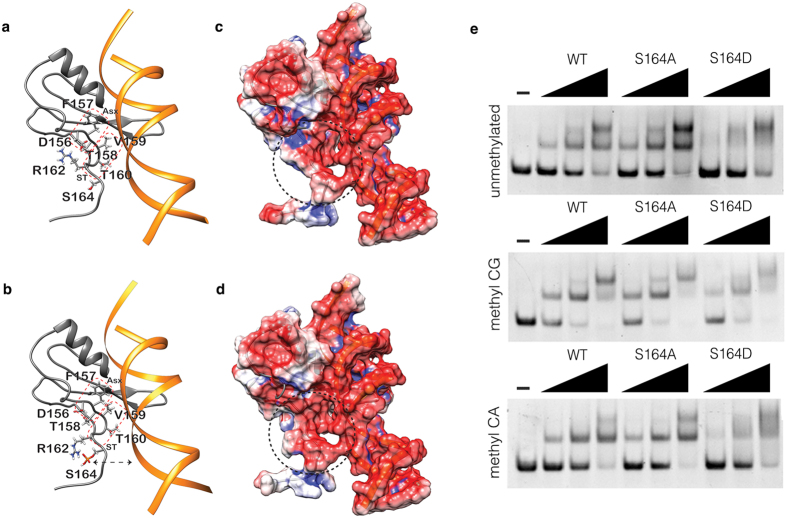
Figure 5. P-S164 MeCP2 shows a more dynamic binding to DNA.
(a) Ribbon representation of the human MBD model in complex with a short DNA fragment. The residues of the Asx and ST structural motifs are reported in stick together with R162 and S164 residues that are not directly involved in the formation of the two motifs. MBD and DNA structures are colored in grey and orange, respectively. Asx and ST motifs are highlighted with a red dotted square. (b) As in panel a, with the addition of S164 phosphorylation. The black dashed arrow represents the electrostatic repulsion effect between the phosphate group of S164 and the DNA backbone. (c) Representation of the electrostatic potential mapped on the molecular surface of the MDB-DNA complex in the absence of phosphorylation. The red and blue colours represent the negatively and positively charged regions respectively. The black dashed circle underlines the C-terminal region that differs in the presence or absence of S164 phosphorylation. (d) As in c but in the presence of S164 phosphorylation. (e) Representative EMSAs showing binding of MeCP2 WT, S164A and S164D peptides to an unmethylated (upper panel), CpG methylated (middle panel) and CpA methylated (lower panel) probe.

