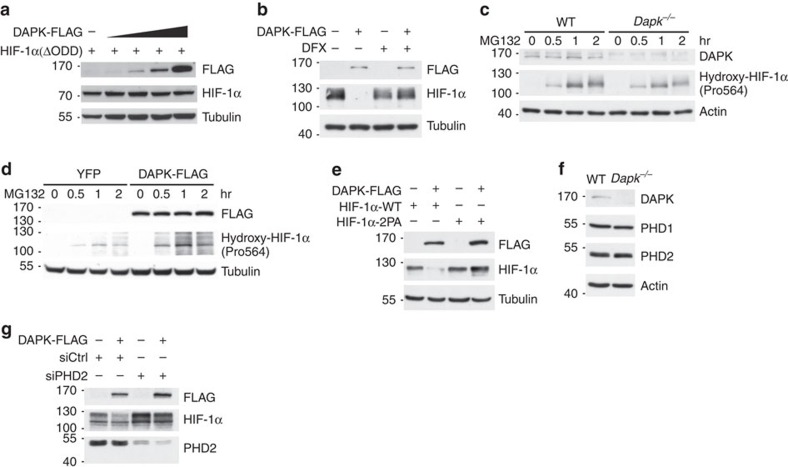
Figure 5. DAPK promotes PHD2-dependent HIF-1α degradation.
(a) Deletion of the oxygen-dependent degradation (ODD) region confers resistance of HIF-1α to DAPK-induced degradation. HEK293T cells were transfected with DAPK-FLAG and HIF-1α[ΔODD] and the levels of HIF-1α were determined 48 h after transfection. (b) PHD inhibitor prevents DAPK-induced HIF-1α degradation in normal T cells. Naive T cells were activated for 48 h and transduced with vector or DAPK-FLAG-IRES-GFP. GFP+ T cells were sorted 48 h later, switched to hypoxic incubation (1% O2) in the absence or presence of DFX (10 μM) for another 24 h, and the levels of DAPK-FLAG and HIF-1α were determined. (c) DAPK deficiency decreases proline hydroxylation of HIF-1α in normal T cells. Naive WT and Dapk−/− T cells were activated with anti-CD3/CD28 for 48 h in normoxic conditions, followed by treatment with MG132 (10 μM). The extents of Pro564 hydroxylation on HIF-1α were determined at the indicated time points. (d) DAPK enhances proline hydroxylation of HIF-1α. YFP control and DAPK-FLAG-expressing Jurkat cells were treated with MG132 (5 μM) in normoxic conditions. The extents of Pro564 hydroxylation on HIF-1α were determined at the indicated time points. (e) Mutation of proline hydroxylation sites confers resistance of HIF-1α to DAPK-induced degradation in T cells. Jurkat cells were transfected with DAPK-FLAG, HIF-1α-WT or HIF-1α[P402A/P564A] (HIF-1α-2PA), as indicated. Twenty-four hours after transfection, cells were incubated under hypoxic conditions (1% O2) for 6 h, then switched back to normoxia for 10 min, and the levels of HIF-1α were determined. (f) DAPK deficiency does not affect the expression of PHD1 and PHD2. WT and Dapk−/− naive CD4 T cells were allowed to differentiate into Th17 cells for 3 days. Cells were harvested and the expression of PHD1 and PHD2 was examined. (g) PHD2-knockdown prevents DAPK-induced HIF-1α degradation in T cells. Jurkat T cells were transfected with DAPK-FLAG, siRNA control (siCtrl), or siRNA for PHD2 (siPHD2). Twenty-four hours later, cells were switched to hypoxic conditions for 6 h, and the levels of HIF-1α, PHD2 and HSP90 were determined. Data are representative of three (a,d) or two (b,c,e–g) independent experiments.

